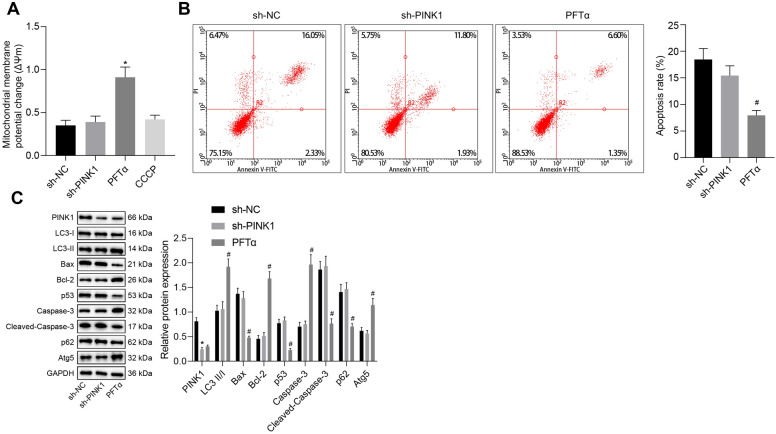
Fig. 5.
PINK1 suppresses mitochondrial damage and cell apoptosis of TNF-α- and IFN-γ-stimulated EGCs via inhibition of p53. A Examination of MMP changes in EGCs. B The apoptosis of EGCs detected by flow cytometry. C Protein expression of PINK1, Bax, Bcl-2, Atg5, p62, p53, caspase-3, and cleaved caspase-3 along with LC3-II/I ratio in the EGCs determined by Western blot analysis. *p < 0.05 vs. EGCs treated with 50 ng/mL of TNF-α and 100 ng/mL of IFN-γ following with sh-NC transfection; #p < 0.05 vs. EGCs treated with 50 ng/mL of TNF-α and 100 ng/mL of IFN-γ following with sh-PINK1 transfection. Measurement data were expressed as mean ± standard deviation. Comparison among multiple groups was conducted by one-way ANOVA with Tukey’s post hoc test. The cell experiment was repeated three times. PFT-α, pifithrin-α

