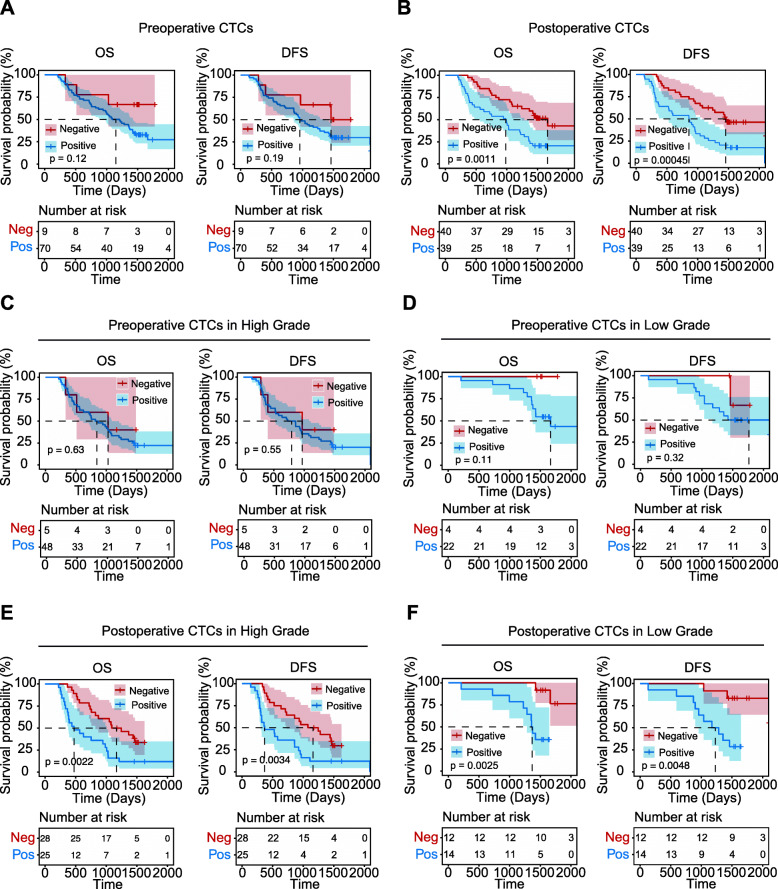
Fig. 3.
Kaplan–Meier survival curve analysis for enrolled glioma patients. A Kaplan-Meier survival curve for OS and DFS of preoperative CTCs. p=0.12 and p=0.19, respectively. There were no statistical differences between the two groups. B OS and DFS of postoperative CTCs. p< 0.0001 and p=0.0011, respectively. There were significant differences between the two groups. C OS and DFS of the high-grade group preoperative CTCs. p=0.63 and p=0.55, respectively. There were no statistical differences between the two groups. D OS and DFS of the low-grade group preoperative CTCs. p=0.11 and p=0.32, respectively. There were no statistical differences between the two groups. E. OS and DFS of the high-grade group postoperative CTCs. p=0.0022 and p=0.0034, respectively. There were significant differences between the two groups. F OS and DFS of the low-grade group postoperative CTCs. p=0.0025 and p=0.0048, respectively. There were significant differences between the two groups. Red, CTC-negative group; Blue, CTC-positive group. p < 0.05 was considered significant, and the 95% CI is shown as a red or blue shadow

