Fig. 4.
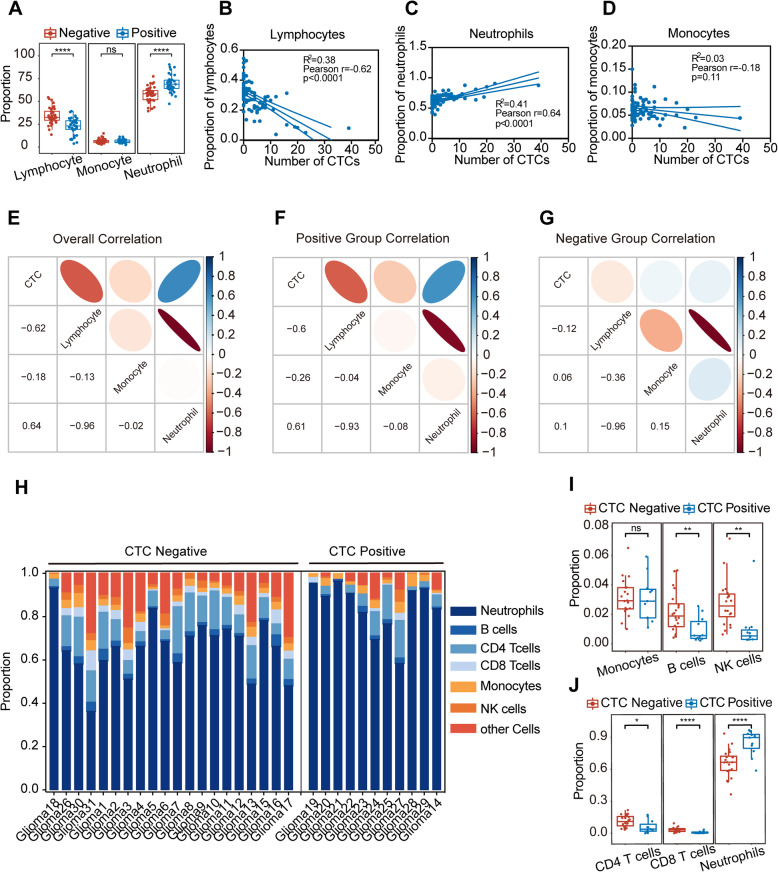
Correlation between postoperative CTCs and clinical blood examination data. A. The proportions of lymphocytes, monocytes, and neutrophils between the CTC-negative group and the CTC-positive group. ns, no significant difference, ****, p< 0.0001. B The correlation between CTCs and the proportion of lymphocytes. Pearson r=− 0.62, p< 0.0001. C The correlation between CTCs and the proportion of neutrophils. Pearson r = 0.64, p < 0.0001. D The correlation between CTCs and the proportion of monocytes. Pearson r = − 0.18, p=0.11. E–G. Correlation heatmap of CTCs and clinical blood examination data in all patients, CTC-positive patients, and CTC-negative patients. Positive correlations are shown in cool colors, while negative correlations (anticorrelations) are shown in hot colors. H Cell components of peripheral blood immune cells in the CTC-positive group and CTC-negative group evaluated by EPIC. I The proportions of monocytes, B cells, and NK cells between the CTC-negative group and the CTC-positive group. ns, no significant difference, **, p< 0.01. J The proportions of CD4 T cells, CD8 T cells, and neutrophils between the CTC-negative group and the CTC-positive group. *, p< 0.05; ****, p< 0.001

