
FIGURE 1.
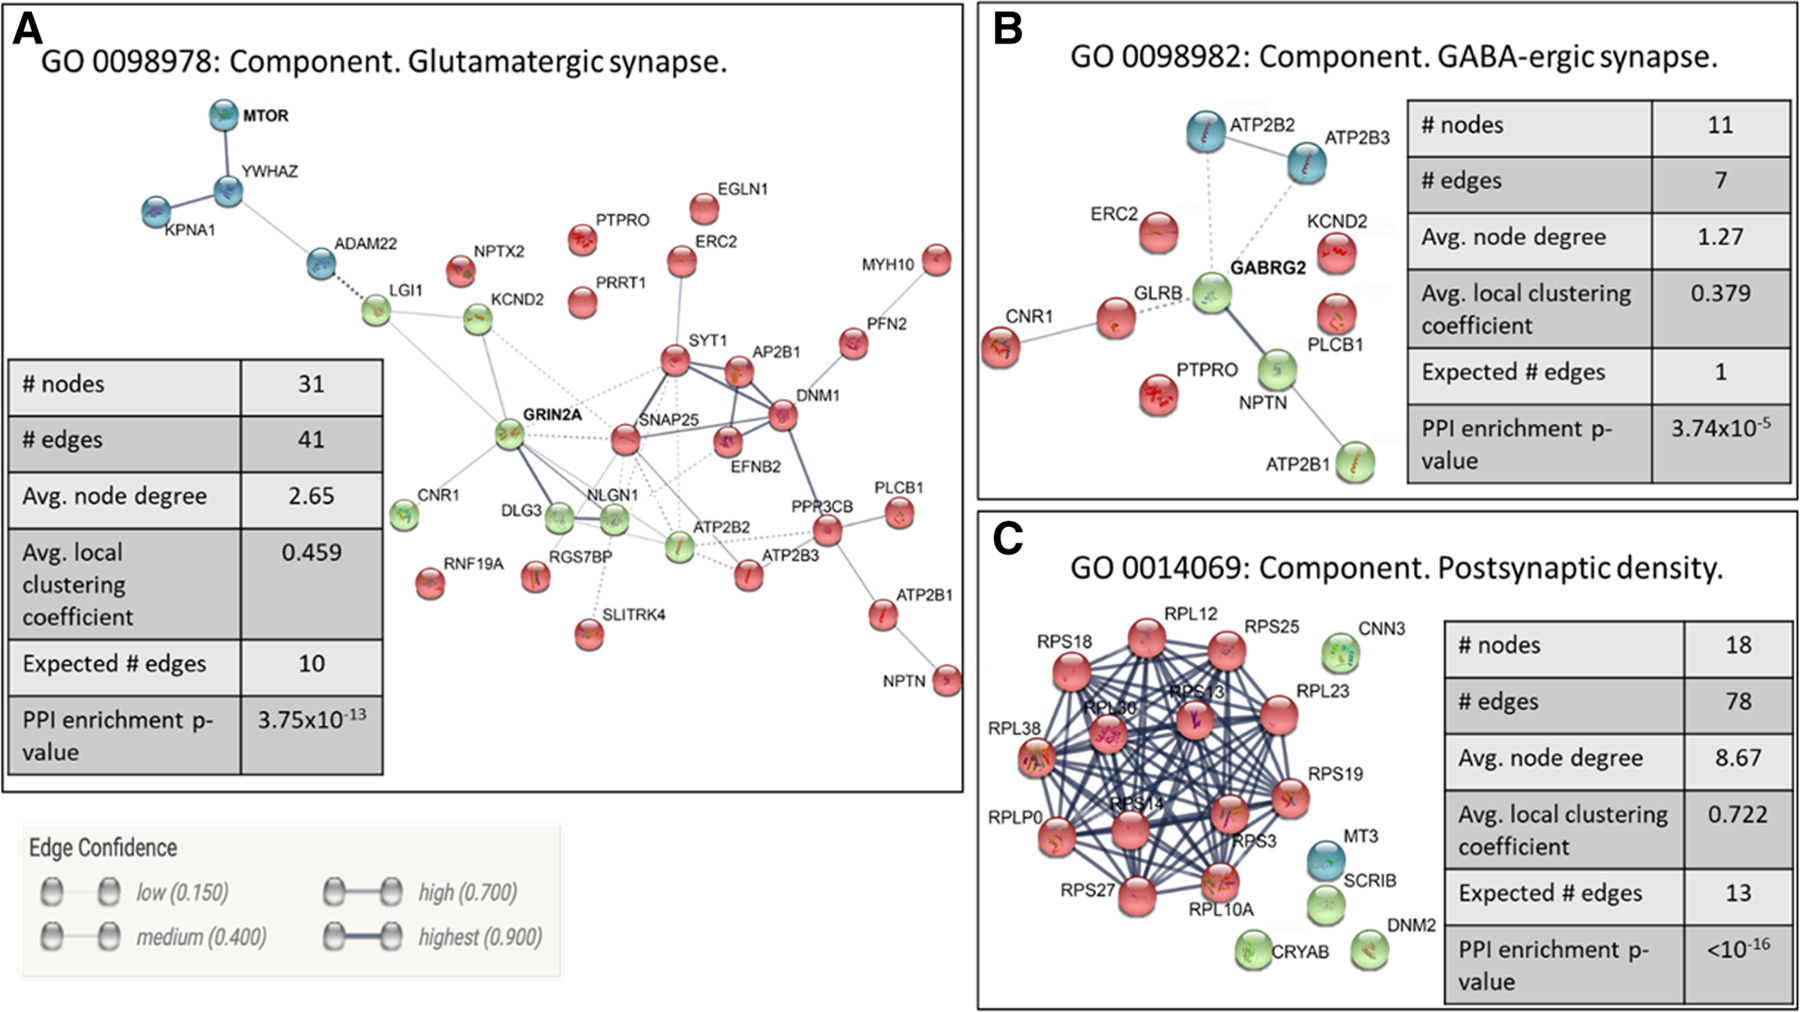
Network representation of three GO-enriched pathways. Genes in (a) and (b) were downregulated while in (c) was upregulated in heavy drinkers as compared with controls. Networks were created using String v11.0. Networks were built using text mining, experiments, databases, and co-expression datasets. The nodes represent proteins encoded by the differentially expressed genes. Edges represent protein–protein interactions. The edge confidence is represented by the thickness of the edge (as shown in the edge confidence description in the figure). Networks are clustered using k-means clustering