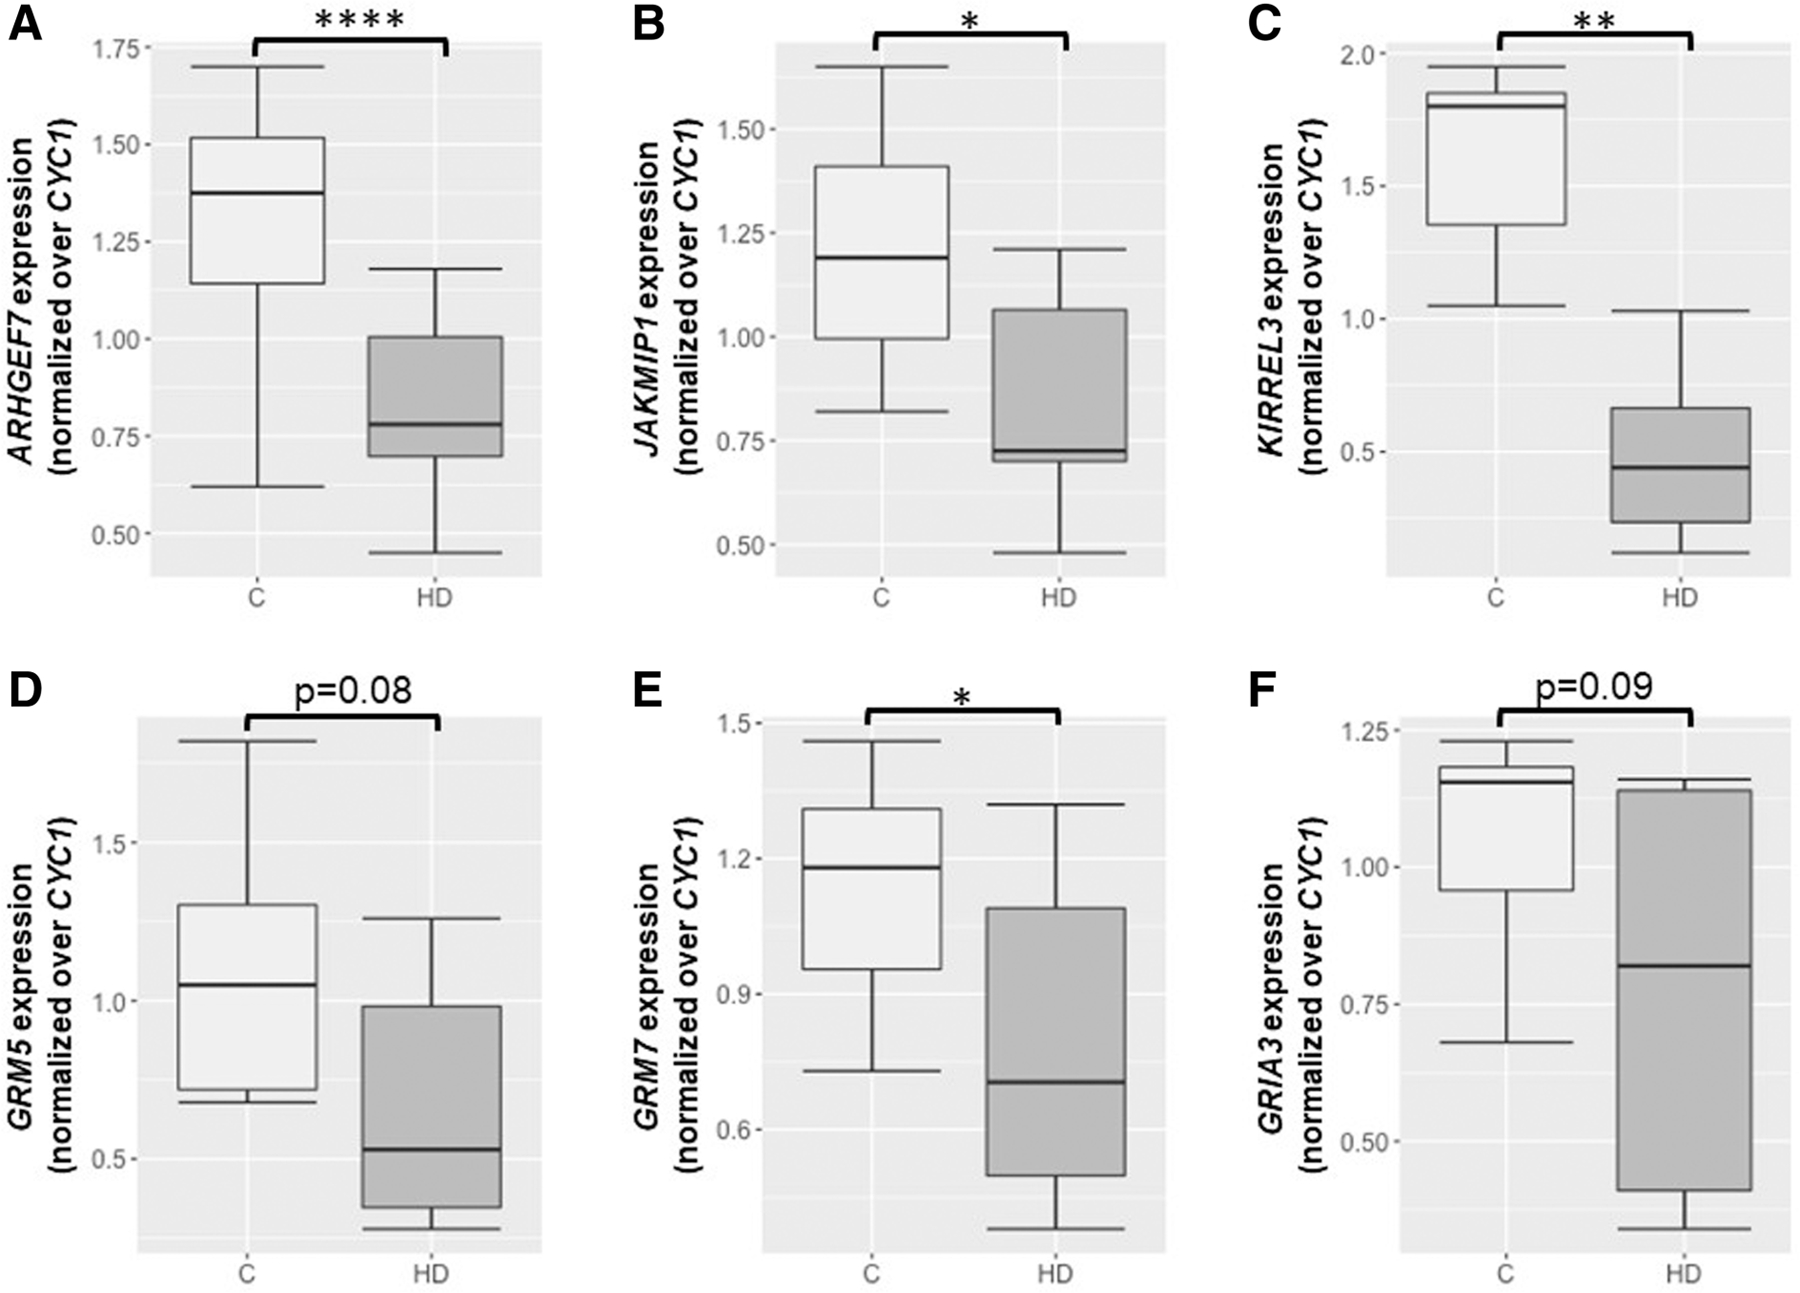
FIGURE 3.

Summary of the gene expression profiles of six genes analyzed by qPCR. The relative expression of ARHGEF7 (a), JAKMIP1 (b), KIRREL3 (c), GRM5 (d), GRM7 (e), and GRIA (f) between controls (ʹC) and heavy/very heavy (HD) drinkers is shown; independent t-test with Bonferroni correction for multiple comparisons, *p < 0.05, **p < 0.01, ****p < 0.0001. Error bars are mean +/− SEM
