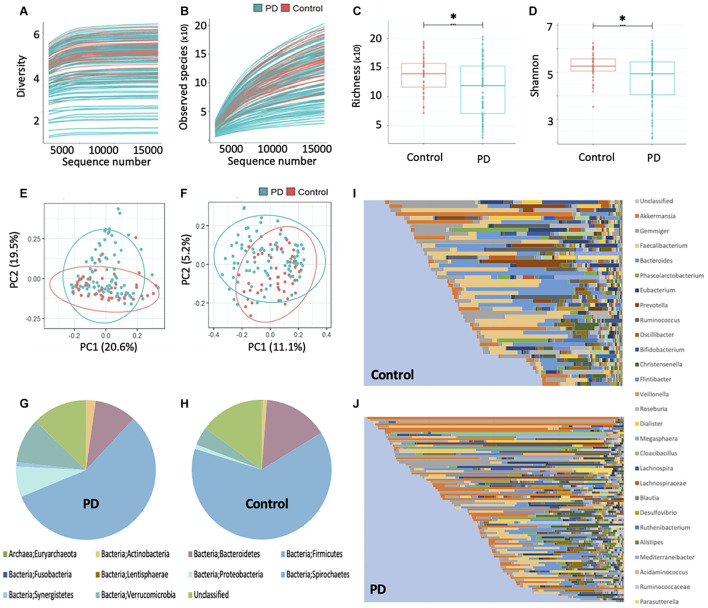
FIGURE 1.
Gut microbiota sequencing overview in controls and PwP. (A) Rarefaction curve based on Shannon diversity index. (B) Rarefaction curve based on species richness index. (C) Comparison of alpha diversity based on species richness index and (D) Shannon diversity index, between PwP and control cohorts using ANOVA. (E) Principal coordinates analysis based on weighted and (F) unweighted UniFrac distance metrics. (G) Relative abundance of bacterial phyla in PwP and (H) control cohorts. (I) Relative abundance of bacterial genera in control and (J) PwP cohorts. Relative abundance was calculated using OTU values, and each color represents a different bacterial taxon. ∗ indicates p < 0.001. Figures were created using R v. 4.0.4 and Microsoft Excel.

