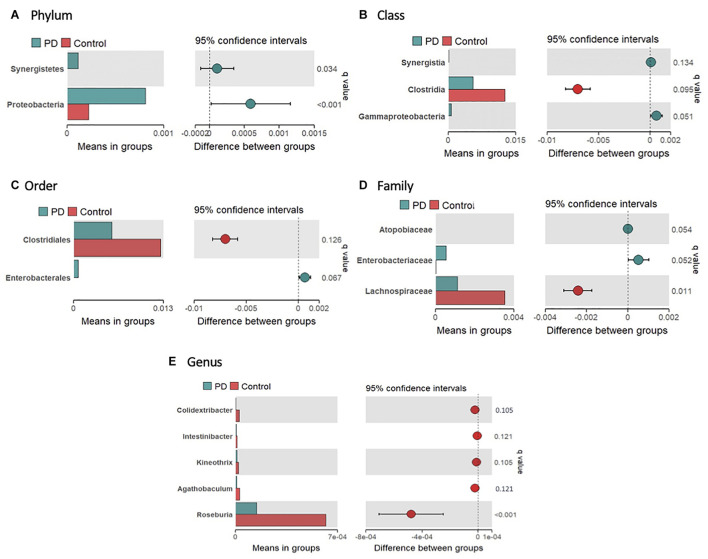
FIGURE 2.
Significantly different taxa in the gut microbiome of controls and PwP following 16S rRNA sequencing. Relative abundance of significantly different bacteria at phylum (A), class (B), order (C), family (D), and genus (E) levels between controls (red) and PwP (blue). Only bacteria with significant differences are presented. The bars on the left side of each figure show mean relative abundance between PwP and controls. The figures to the right represent the difference between means of PwP and control participants, with error bars representing the 95% confidence interval. Q-values are presented above each individual taxon and were generated using Wilcoxon rank-sum test followed by FDR adjustment with Storey’s q-value. q < 0.15 was considered statistically significant. Figures were created using R v. 4.0.4.

