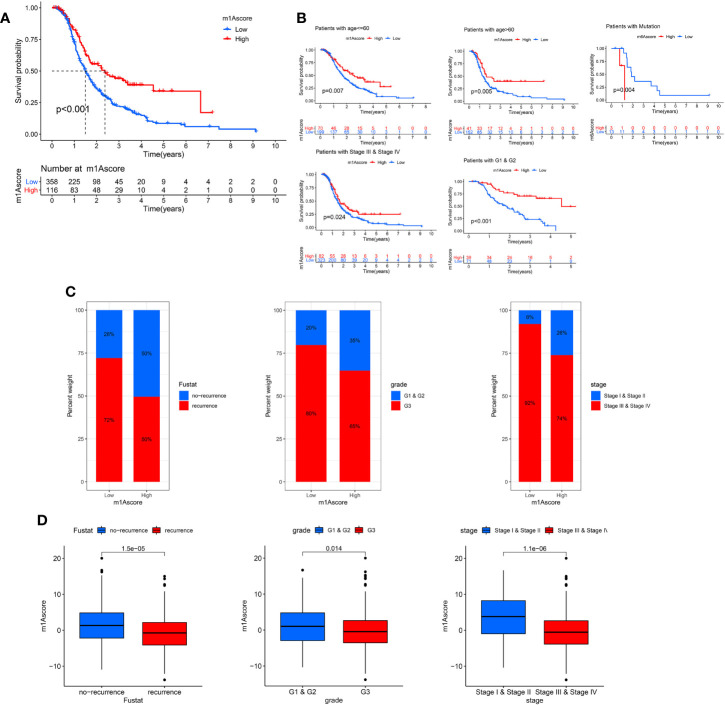
Figure 6.
Characteristics of m1A modification in OC patient subtypes. (A) Survival analyses of low and high m1Ascore patient groups in OC cohort using Kaplan-Meier curves. (B) Kaplan-Meier curves depicted the survival difference between low and high m1Ascore in the stratified analysis of OC patients, including age, grade, stage, and BRCA mutation. (C) The proportion of patient survival status, stage and grade in high and low m1Ascore groups. (D) Boxplots for m1Ascore between different characteristics OC patients, including patient survival status, stage and grade.

