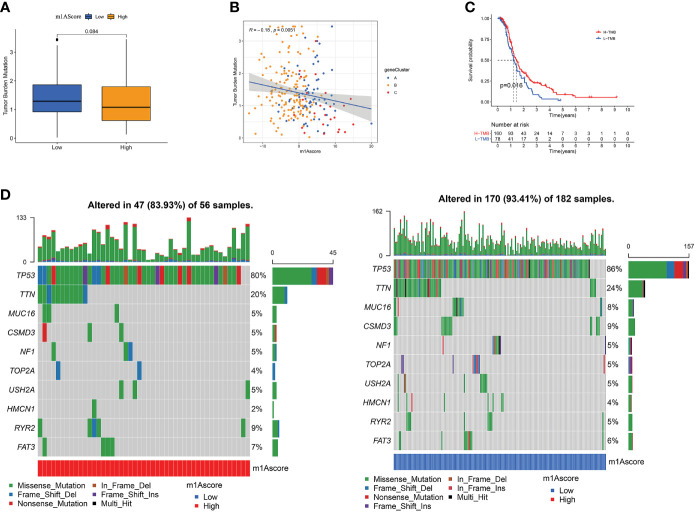
Figure 7.
The Correlation between the m1Ascore and somatic variants. (A) TMB difference in the high and low m1Ascore subgroups. (B) Scatterplots depicting the positive correlation between m1Ascores and tumor mutation load. (C) Kaplan-Meier curves for high and low TMB groups of the TCGA-OV patient. (D) The single-nucleotide variant was constructed using high m1Ascores on the left (red) and low m1Ascores on the right (blue). Individual patients are represented in each column.

