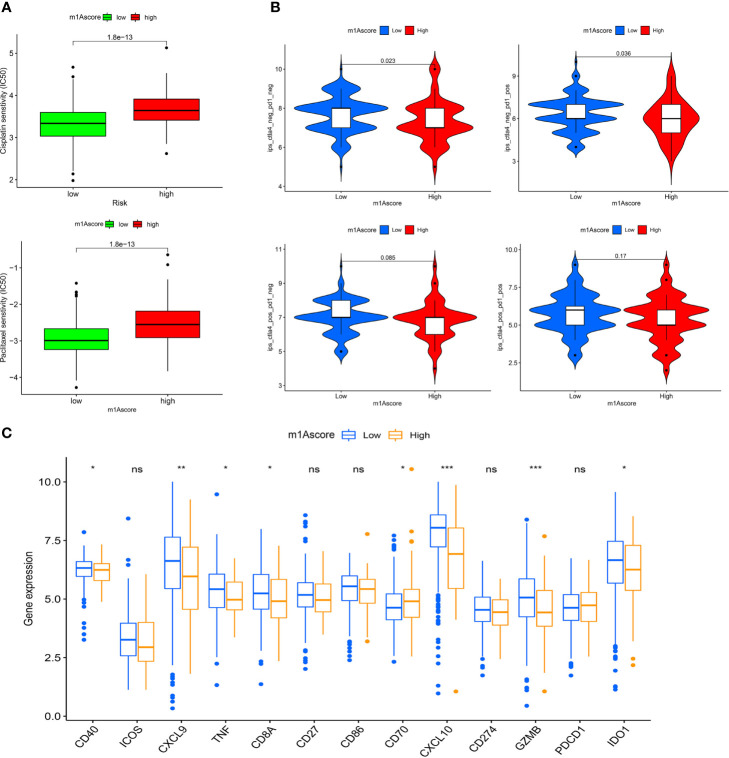
Figure 8.
m1A modification patterns in the role of OC clinical therapies (A) Box plot showing the sensitivity of patients with high and low m1Ascore subgroups to chemotherapy drugs, including cisplatin and paclitaxel. (B) The association between IPS and immune checkpoints in OC patients with different m1Asocre. (C) The expression of immune-relevant genes in high and low m1Ascore subgroups. *P < 0.05; **P < 0.01; ***P < 0.001; ns, not significant.

