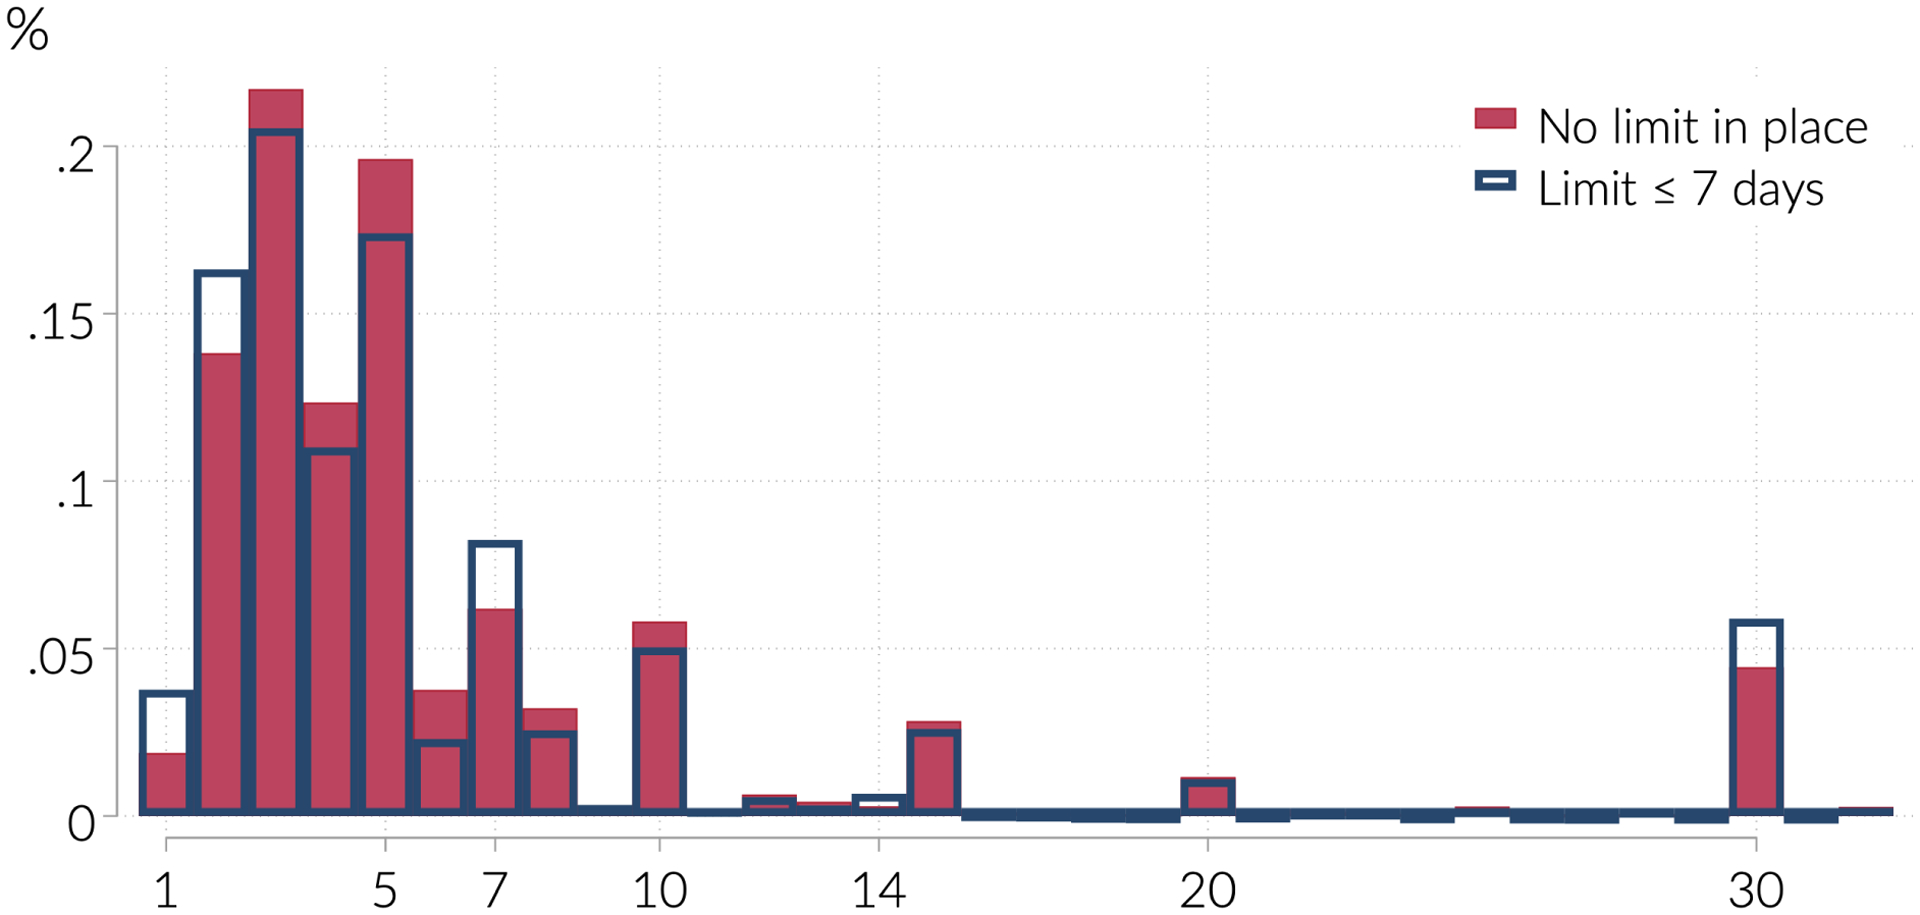
Figure 2:

Distribution of days supply in initial prescription
Notes: Figure shows the proportion of initial prescriptions with the indicated number of days supply, for states which never or have not yet implemented limits on days supply (hollow bars) and for states which have implemented limits of 7 days supply or fewer (solid bars) by March of 2017. Including all initial prescription states does not meaningfully alter the distribution.
