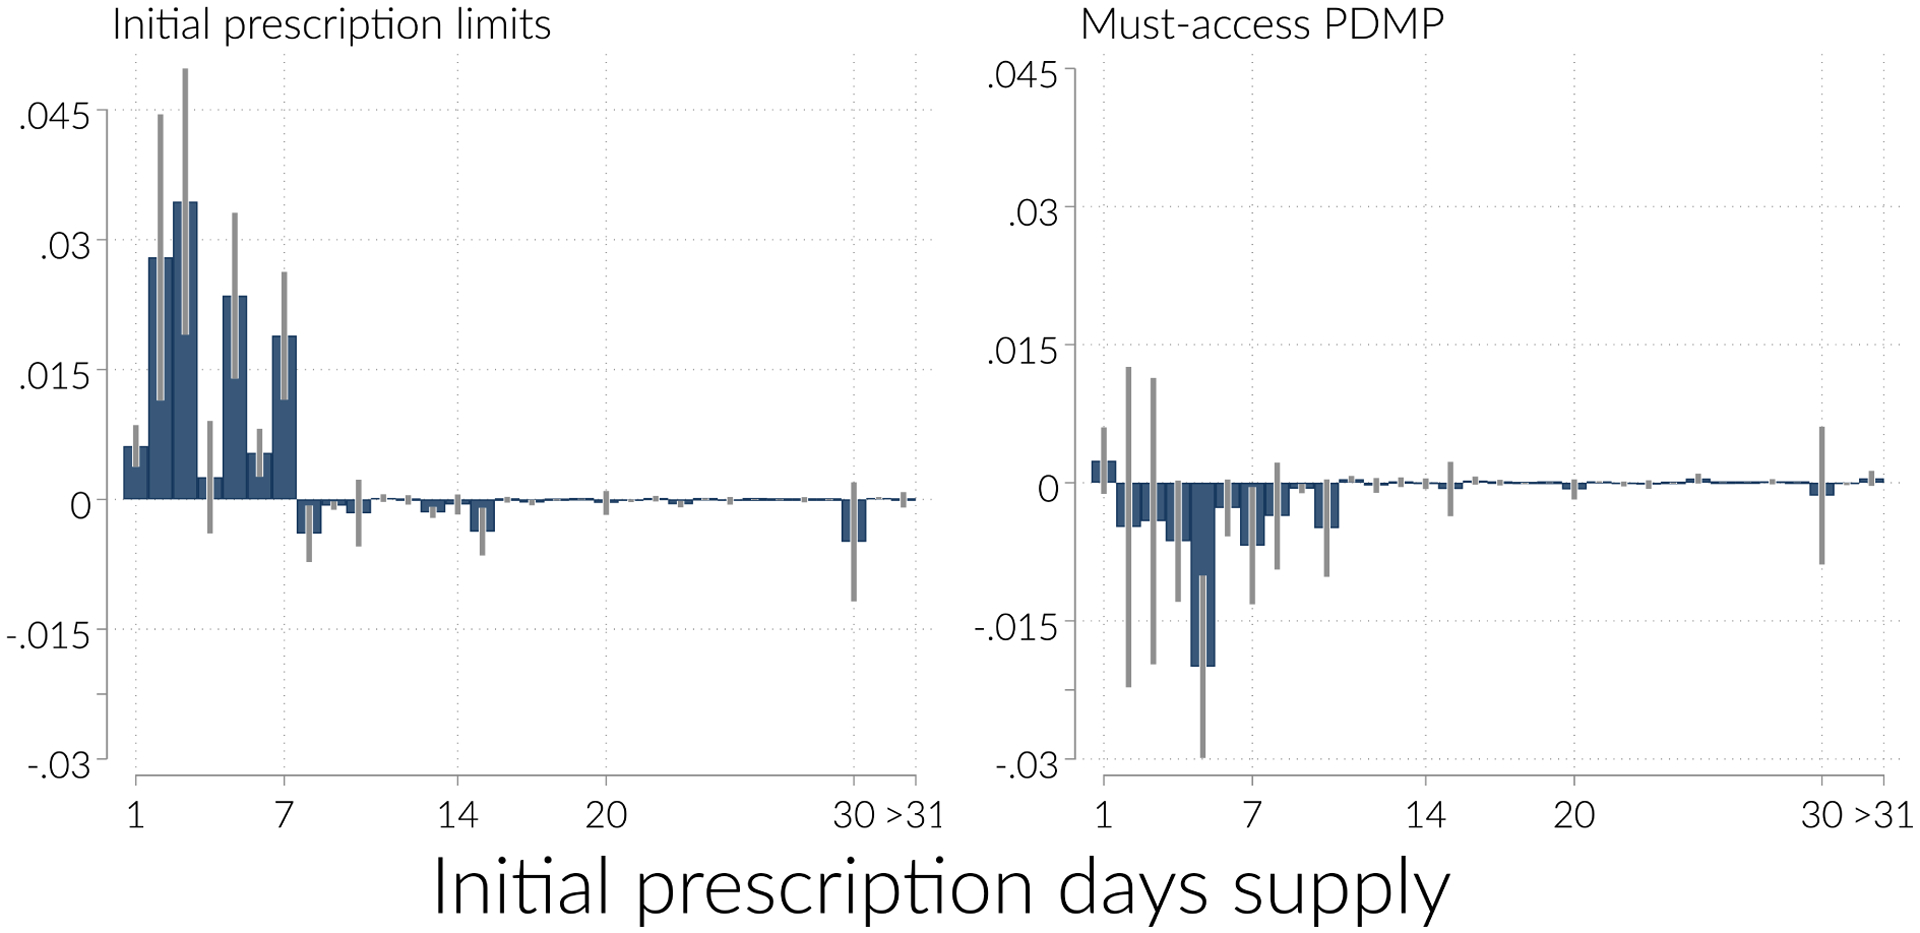
Figure 4:

Effect distribution of days supply
Notes: Figure shows the estimated coefficient on initial prescription limits (left panel) and MA-PDMP (right panel), obtained from Equation 1 with indicators for “initial prescription is for d days supply” as the dependent variable. Each point in each panel is from a separate regression.
