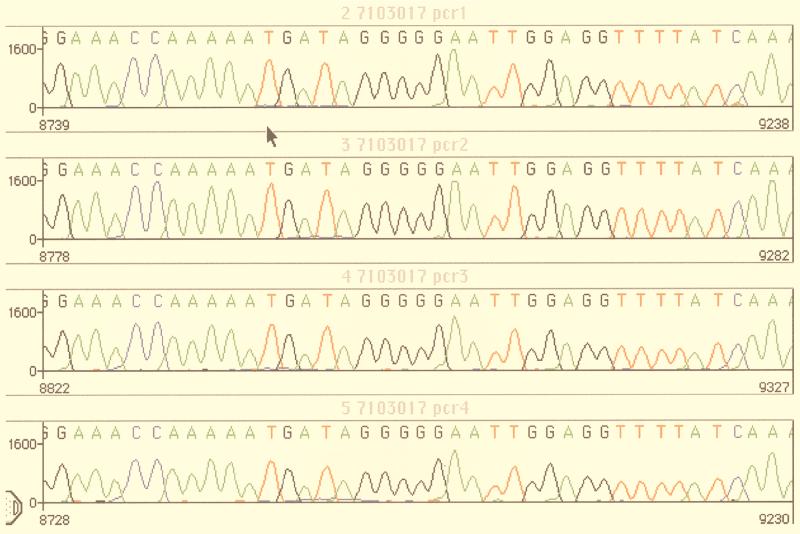
FIG. 1.
Assessment of accuracy of sequence data. The data show the electropherograms resulting from a PCR amplification experiment performed in quadruplicate. Four aliquots (1 μg each) of the same DNA extract were amplified, and the protease gene was sequenced as described in Materials and Methods. The arrow shows the position of codon 46 (ATG) of the protease gene. The sequences were aligned with Sequence Navigator software.

