Figure 8.
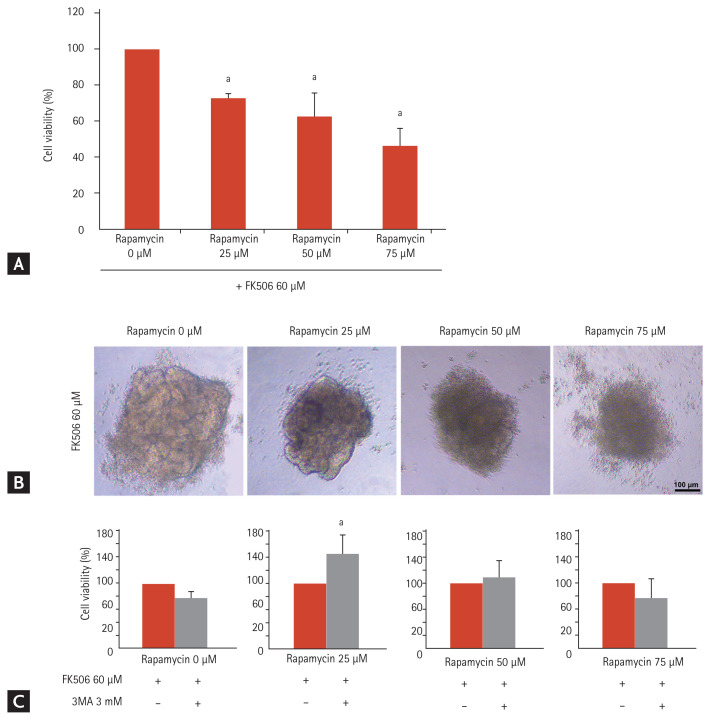
Increase in toxicity in the tacrolimus and rapamycin model in vitro. (A) Cell viability of the kidney organoids treated with 60 μM tacrolimus and rapamycin at doses of 25, 50, and 75 μM (n = 3). (B) Representative image of the morphology of tacrolimus and rapamycin-treated kidney organoids. Scale bars: 100 μm. (C) Cell viability with inhibition of autophagy by 3-methyladenine (3-MA) in kidney organoids treated with tacrolimus and/or rapamycin (n = 3). Values are mean ± standard error of the mean. ap < 0.05.

