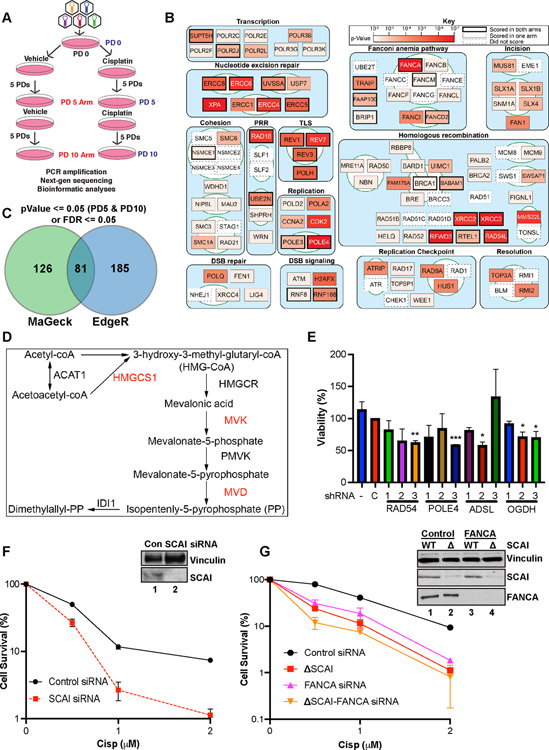
Figure 1. Genetic screen identifies genes important for cisp sensitivity including SCAI.
(A) Screen schematic. Cisp treatment was 1.5 μM at PD0 and was repeated at 1 μM at PD5 for the PD10 arm. PD - population doubling. (B) Pathway map showing the top scoring known DNA repair genes from our screens. Some DNA replication and RNA transcription genes were omitted for space constraints. (C) Genes with significant p-values at both PD5 and PD10 or false discovery rates (FDR) <= 0.05 were included. Venn diagram shows the hits identified by EdgeR and MAGeCK. (D) Mevalonate pathway map. Red - genes that scored in the screen. (E) U2OS cells were transduced with lentiviruses expressing shRNAs against the indicated genes, no shRNA, or a control shRNA, C. Cells in 96-well plates were treated with vehicle or 1 μM cisp for 24 h and analyzed by AlamarBlue viability assays at 72 h. Data is mean ± SEM of two independent experiments. *= p<0.05, **= p<0.01, ***=p<0.001. (F) Colony survival assays (CSA) showing survival of control or SCAI siRNA-treated U2OS cells treated with cisp. Data are normalized to untreated cells for each siRNA condition. Mean ± SEM survival of 2 independent experiments shown. Inset. Western blot showing depletion of SCAI. (G) CSA showing survival of WT and SCAI null with or without siRNA to FANCA. Mean ± SEM of two independent experiments shown. Inset. Western blots showing SCAI and FANCA depletion.

