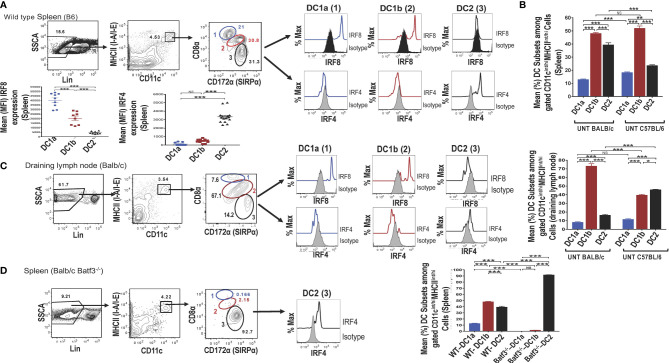
Figure 1.
Identification of 2 subsets of CD8+ Batf3 dependent DCs. Spleen cells from untreated wild-type (WT) C57BL/6 or BALB/c mice were stained and analyzed by flow cytometry for DC susbsets. (A) Show representative two color FACS gating strategy to identify MHCII(I-A/I-E)+ CD11+ total DCs after gating on lineage negative (CD3, B220, CD19, CD56, Gr-1) spleen cells. Boxes in panels show the percentages of cells enclosed. Gated total DCs cells were further analyzed for CD8 versus CD172a, and 3 discrete populations were observed; populations 1 (DC1a), 2 (DC1b), and 3 (DC2) (indicated by blue, red, and black ovals) respectively. The 3 populations were analyzed for intracellular staining of the Irf8 and Irf4 nuclear factors compared to isotype control staining. Representative histograms are shown as well as the mean (MFI) for Irf8 and Irf4 staining intensity among the gated DC populations (n = 8-10). One-way ANOVA (Holm-Sidak’s multiple comparison test) was used for statistical analysis. *p < 0.05, **p < 0.01, ***p < 0.001, NS-not significant (p > 0.05). (B) Compares the mean (± SEM) percentages of populations 1 (DC1a), 2 (DC1b), and 3 (DC2) among total DCs from the spleens of untreated (UNT) WT C57BL/6 and BALB/c mice (n =18-20). (C) Shows staining for CD8α versus CD172 on gated CD11c+MHCII+ draining lymph node cells from WT BALB/c mice. The 3 gated populations of DCs were stained for Irf8 and Irf4, and representative histograms are shown. The bar graphs compare the mean percentages of DC1a, DC1b, and DC2 cells from draining lymph nodes of WT BALB/c and C57BL/6 mice (D) Shows representative two color FACS patterns of CD11c+ MHCII+ cells among spleen cells from Batf3 -/- BALB/c mice. Gated cells from each box were further analyzed for CD8 versus CD172a. Too few populations 1 and 2 cells were available to stain for nuclear factors, and expression of Irf4 by population 3 is shown in a representative histogram. The mean percentages of the 3 DC populations are compared from WT versus Batf3-/- BALB/c mice in the bar graphs.

