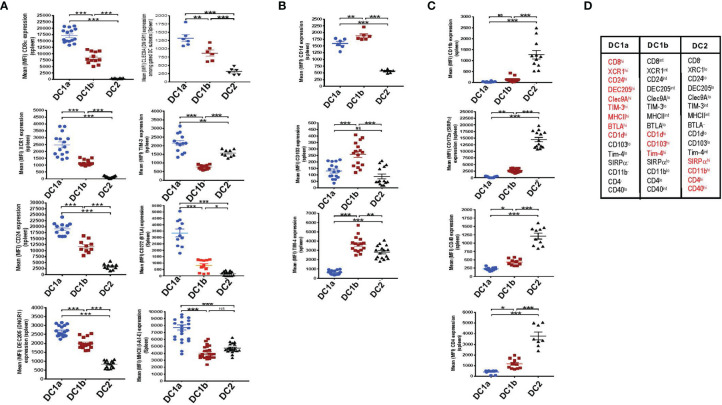
Figure 2.
DC1a and DC1b cells in the spleen differ in their expression of multiple surface markers that also distinguish them from DC2 cells. (A) Shows individual and mean (MFI) levels of staining intensity of receptors that are most highly expressed on gated population 1(DC1a) cells including CD8a, XCR1, CD24, DEC205, Clec9A, TIM-3, MHCII, and BTLA (CD272) in WT BALB/c spleen cell samples. (B) Shows MFI levels of receptors most highly expressed on population 2 (DC1b) cells including CD1d, CD103, (DNGR1), and TIM-4. (C) Shows MFI levels of receptors most highly expressed on population 3 (DC2) cells including CD11b, CD172a (SIRP), CD40, and CD4. (D) Table shows the summary patterns of high expression of surface receptors on 3 DC subsets in the spleen. Receptors in red are those with MFIs that were significantly increased as compared to that of the two other DC populations. (N = 10-20). One-way ANOVA (Holm-Sidak’s multiple comparison test) was used for statistical analysis. *p < 0.05, **p < 0.01, ***p < 0.001, NS, not significant (p > 0.05). MFI, mean fluorescence intensity.

