Figure 4.
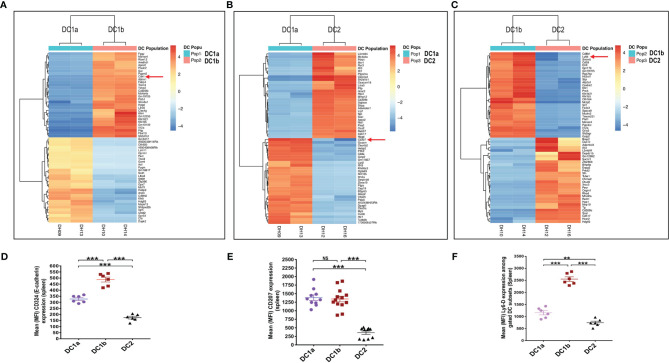
Gene expression profiling reveals additional differences between the 3 DC subsets. (A) Heat map of genes with significantly increased or decreased expression levels (as determined by RNA-seq analysis) in sorted DC1a (Pop 1) versus DC1b (Pop 2) or (B) DC1a (Pop 1) versus DC2 (Pop 3) or (C) DC1b (Pop 2) versus DC2 (Pop 3) from the WT BALB/c spleen. Each row represents a gene identified on the right side of the map, and each column represents a result from a single sample. The color scale shown on the map shows the relative expression levels of the genes across all the samples. Red and yellow shades represent higher expression levels, while blue shades represent lower expression levels. (D–F) Representative staining intensities and MFI of upregulated receptors CD207 (langerin), CD324 (E-cadherin; Cdh1), and Ly6-D cells on DC subsets (n = 10-20). The genes of these three markers were identified by the RNAseq analysis and were stained to confirm their expression at the protein level. One-way ANOVA (Holm-Sidak’s multiple comparison test) was used for statistical analysis of MFI. *p < 0.05, **p < 0.01, ***p < 0.001, NS, not significant (p > 0.05).

