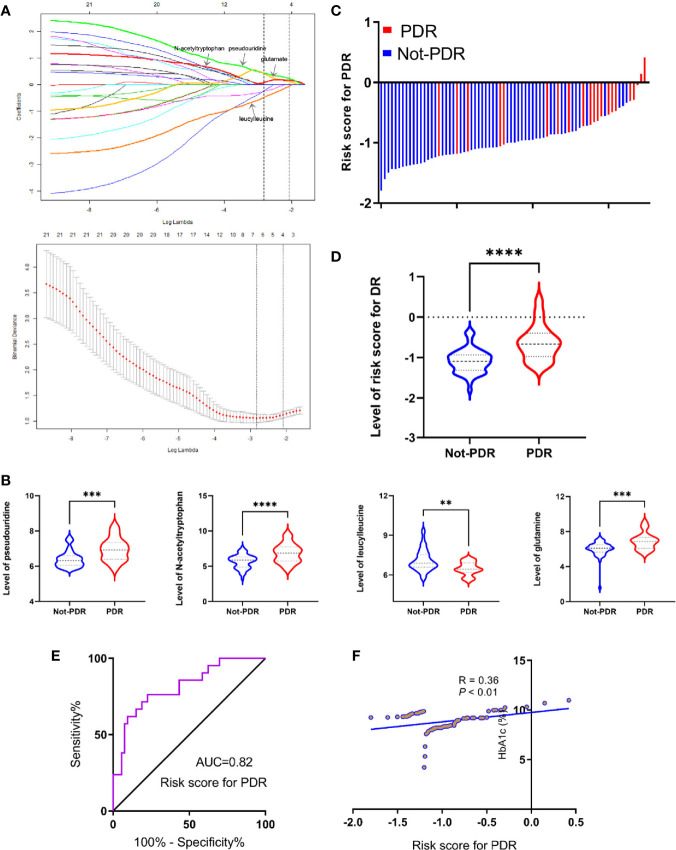
Figure 5.
Development of risk score for PDR using the least absolute shrinkage and selection operator regularization (LASSO-LR) model. (A) Dotted vertical lines were drawn at the optimal values with Lambda (log), by using the minimum criteria and the 1 standard error of the minimum criteria (the 1-SE criteria). (B) Statistical analysis of pseudouridine, glutamate, leucylleucine and N-acetyltryptophan between PDR and not-PDR group (**p < 0.01; ***p < 0.001; ****p < 0.0001). (C) Distribution of the risk score in the group. (D) Statistical analysis for distribution of risk score between PDR and not-PDR group (****p < 0.0001). (E) ROC curves were created to evaluate the power of risk score. (F) A linear correlation analysis between risk score and HbA1c levels.

