Figure 2.
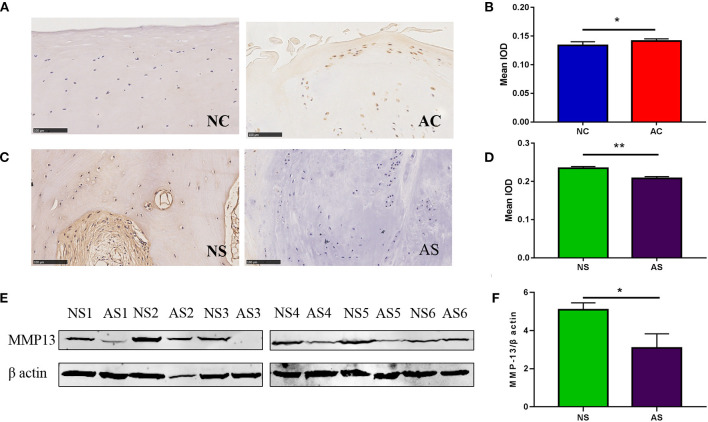
MMP-13 expression in the cartilage and subchondral bone of patients with OA. The representative images of MMP-13 levels in the NC and AC (A) and the semiquantitative results of MMP-13 expression in the NC and AC (B). NC represents less-worn cartilage, AC represents severe-worn cartilage; IOD indicates integrated optical density (p < 0.05). The error bars indicate mean ± standard error of the mean. *p < 0.05. (C) The representative images of MMP-13 levels in the subchondral bone. NS represents less-worn subchondral bone, AS represents severe-worn subchondral bone. (D) The semiquantitative results of MMP-13 expression in the subchondral bone in the NS and AS. NS represents less-worn subchondral bone, AS represents severe-worn subchondral bone; IOD indicates integrated optical density. The error bars indicate mean ± standard error of the mean. *p < 0.05, **p < 0.01. (E) Western blotting findings of MMP-13 expression in the subchondral bone. NS represents less-worn subchondral bone, AS represents severe-worn subchondral bone. (F) The quantification of western blot shows the expression of MMP-13 in subchondral bone. NS represents less-worn subchondral bone, AS represents severe-worn subchondral bone. The error bars indicate mean ± standard error of the mean. **p < 0.01.

