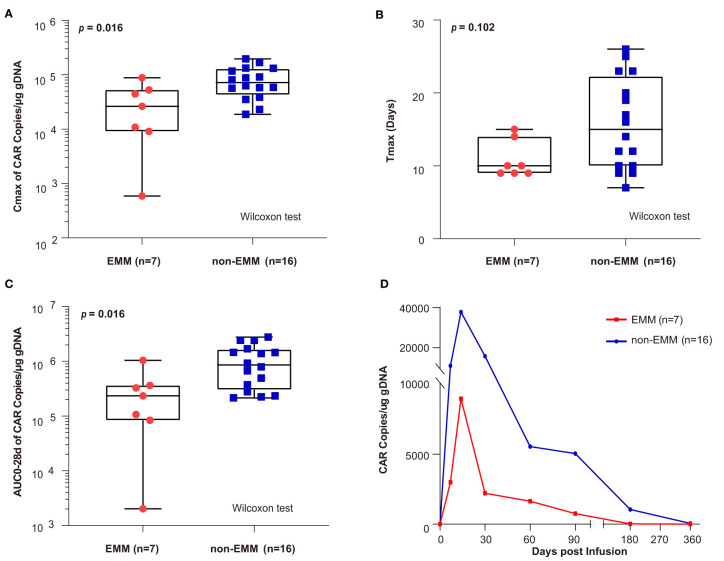
Figure 4.
Comparison of CAR transgene kinetics between EMM patients and non-EMM patients receiving novel fully human anti-BCMA CAR-T infusion conducted in our center (A–C) the comparison of Cmax, Tmax, and area under the curve of the transgene level from infusion to 28 days (AUC0–28d) between EMM and non-EMM patients that received novel fully human anti-BCMA CAR-T therapy. The p value is based on a twosided Wilcoxon ranksum test and p values less than 0.05 (two-tailed) was considered statistically significant. (D) The Car copies from infusion to the last follow-up were compared between EMM and non-EMM patients. Data presented as a geometric mean. AUC028d, area under the curve during the first 28 days after the infusion; Cmax, peak value of CAR copies; Tmax, the time elapsed till peak value appeared.

