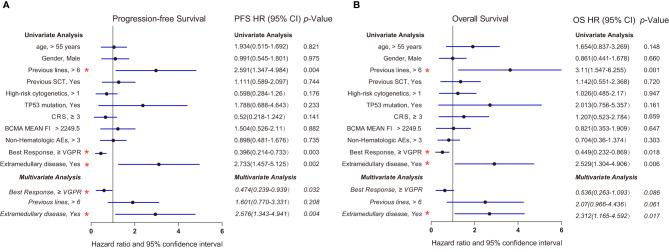
Figure 5.
Forest plots showing the association between risk factors and survival in our center (A) Progression-free survival (Cox regression, HR, and 95% CI). (B) Overall survival (Cox regression, HR, and 95% CI). Multivariate Cox regression analysis was performed by using the significant prognostic factors identified in univariate analysis. Multivariate analysis was indicated in italics. p values less than 0.05 (two-tailed) were considered statistically significant (highlighted with red “*”). AEs, adverse events; CRS, cytokine release syndrome; HR, hazard ratio; MFI, Mean Fluorescence Intensity; SCT, stem cell transplantation; VGPR, very good partial response.

