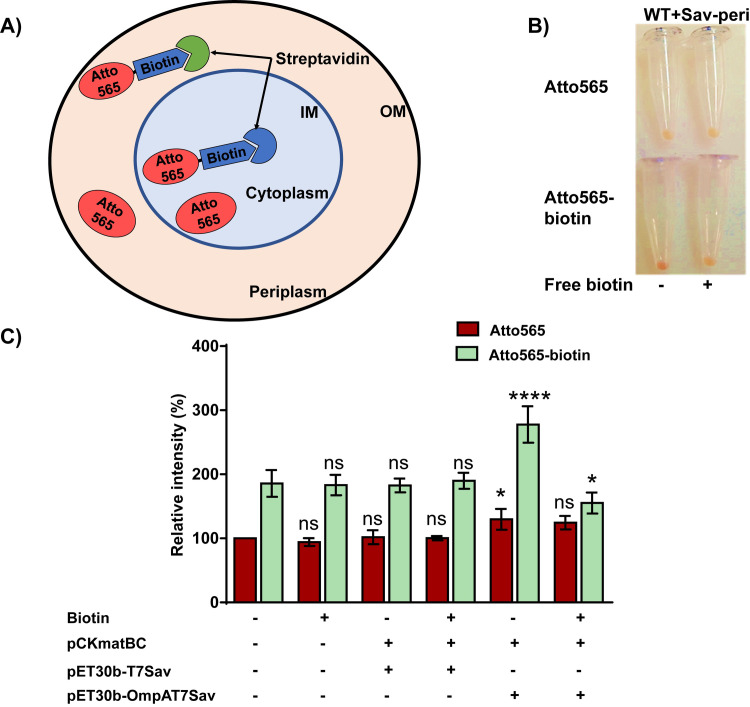
Fig 3. Accumulation of Atto565 and Atto565-biotin in E. coli expressing streptavidin either in the periplasm or cytoplasm.
A) Schematics showing plasmid-expressed streptavidin binds to Atto565-biotin. B) Image of cell pellets showing redder color (higher accumulation) of Atto565-biotin in cells expressing periplasmic streptavidin and decrease in the accumulation in the presence of free biotin. C) Quantitative analyses of accumulation of Atto565 and Atto565-biotin in cells expressing streptavidin in the presence or absence of free biotin. Figure shows the representative data from three independent experiments. Data were presented as mean±S.D. (Two-way analysis of variance; ****p<0.0001, *p<0.05). Asterisks above the Atto565 accumulation bar represent significance when compared them with Atto565 accumulation in WT strain, whereas asterisk above the Atto565-biotin accumulation bar represent the significance when compared with Atto565-biotin accumulation in WT strain.

