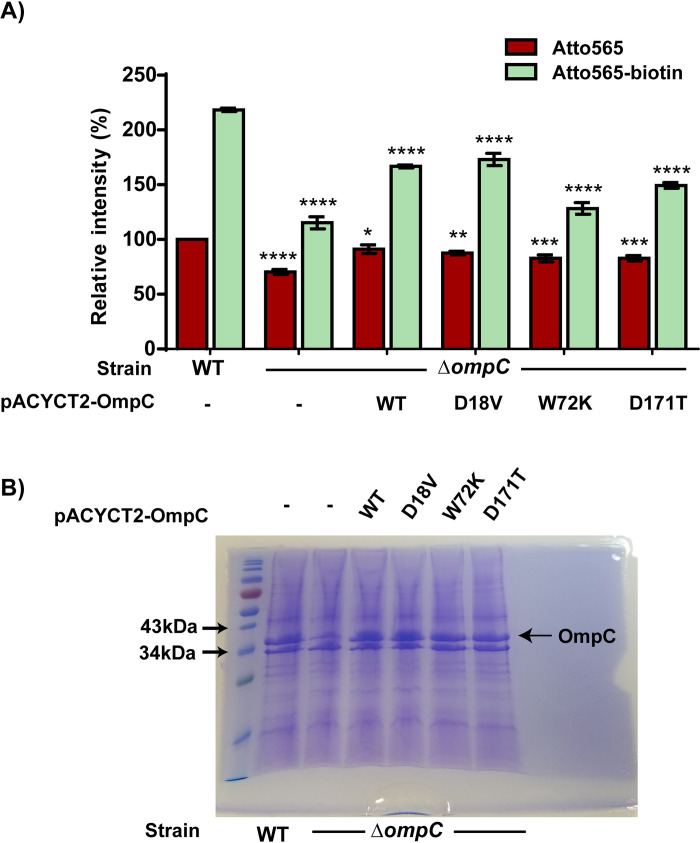
Fig 6. Accumulation of Atto565 and Atto565-biotin upon plasmid complementation of wild type OmpC as well as OmpC with different single mutations.
Figure shows the representative data from three independent experiments. Data were represented as mean±S.D. (Two-way analysis of variance; *p<0.05, **p<0.01, ***p<0.001, ****p<0.0001). Asterisks above the Atto565 accumulation bar represent significance when compared them with Atto565 accumulation in WT strain, whereas asterisk above the Atto565-biotin accumulation bar represent the significance when compared with Atto565-biotin accumulation in WT strain.

