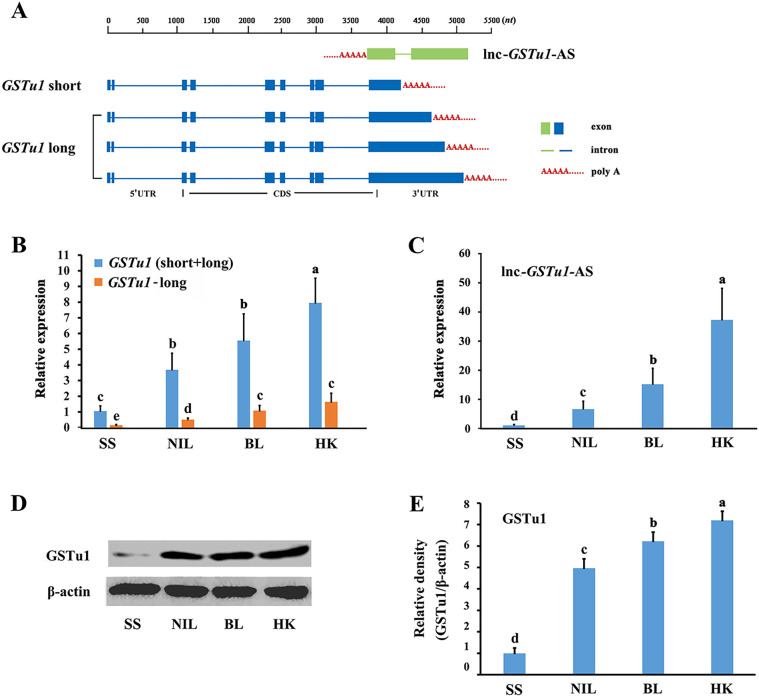
Fig 1. Structure and location of GSTu1 and lnc-GSTu1-AS and their relative expression in susceptible and three chlorantraniliprole-resistant populations.
A: The structure and location of full-length GSTu1 and lnc-GSTu1-AS. Relative expression of GSTu1 in a susceptible population (SS) and three chlorantraniliprole-resistant populations (NIL, BL and HK) by qRT-PCR (B) and Western blotting (D, E). C: Relative expression of lnc-GSTu1-AS in a susceptible population (SS) and three chlorantraniliprole-resistant populations (NIL, BL and HK) by qRT-PCR. Different lowercase letters represent significant differences (one-way ANOVA followed by Tukey’s multiple comparison tests, P < 0.05).

