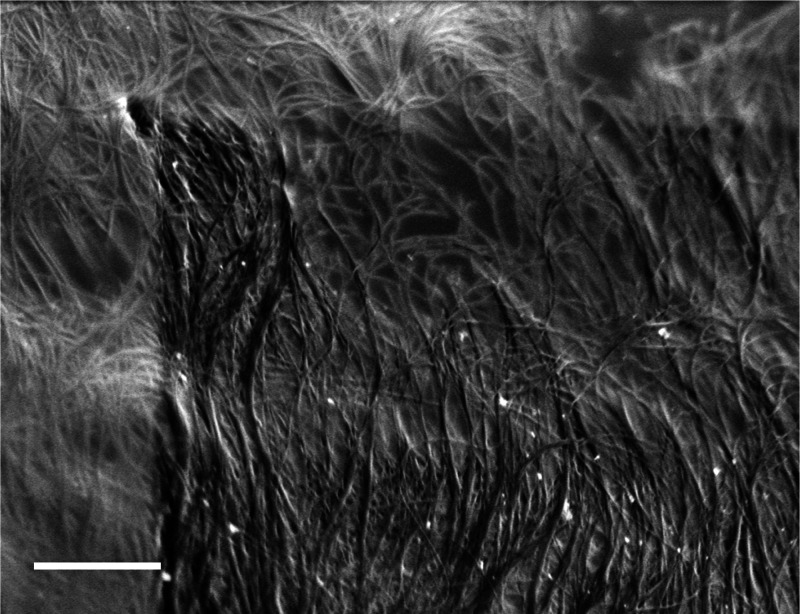
Figure 5.
Cryo-SEM SEI micrograph of 3 wt % 1.5 Meijo CNTs in CSA. The darker area was irradiated longer than the lighter area, exposing the CNTs after etching away some of the CSA, showing clearly bundles of CNTs, forming a nematic liquid-crystalline phase. The bright spots are nanoparticles of the iron catalyst exposed by the etching. AV = 1.4 kV, WD = 2.8 mm, and the scale bar corresponds to 500 nm.

