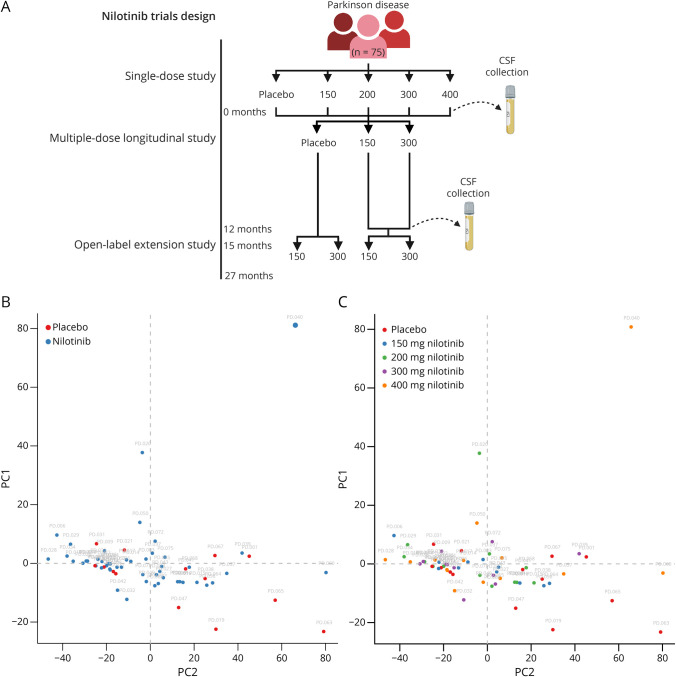
Figure 1. Cross-sectional Analysis of miRNA After a Single Dose of Nilotinib.
(A) Schematic of the clinical trial design. This schematic was created using BioRender.com. (B) Principal component analysis of miRNA expression in the single-dose study for treatment vs untreated effects with placebo- (red) and nilotinib- (blue) treated populations and (C) placebo (red), 150 mg (blue), 200 mg (green), 300 mg (purple), and 400 mg (orange) nilotinib-treated populations. Principal component analysis classified 63 participants into groups using 2,559 miRNAs. PC1 and PC2 are depicted.

