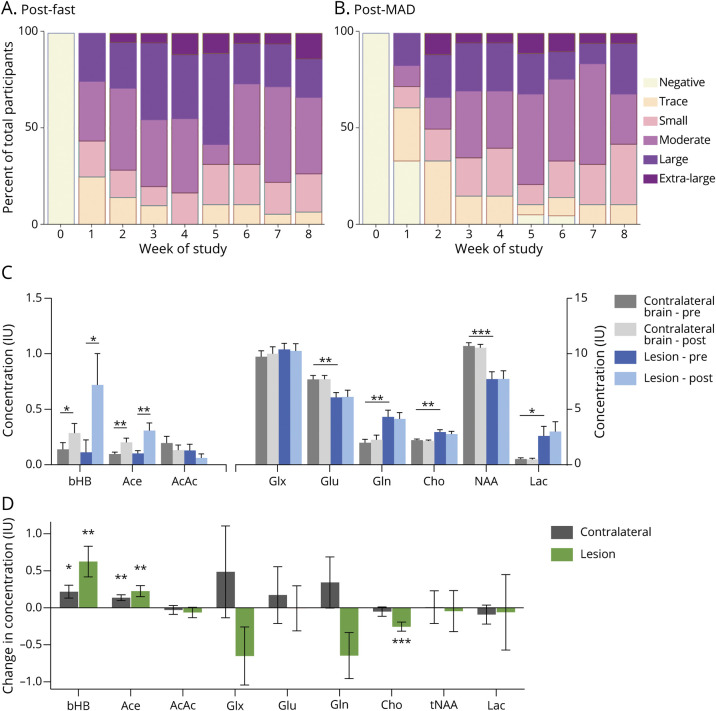
Figure 2. Effect of GLAD Dietary Intervention on Systemic Ketonuria and Cerebral Ketones and Metabolites.
Urine ketone (acetoacetate [AcAc]) concentration measured (A) after fasting days and (B) after modified Atkins diet (MAD) days each week on study. Percentage of participants reporting data (N = 18–21) with moderate or greater ketosis after fasting days was 71% at week 2, 83% at week 4, 68% at week 6, and 78% at week 8. AcAc concentrations: trace 5 mg/dL, small 15 mg/dL, moderate 40 mg/dL, large 80 mg/dL, and extra-large 160 mg/dL. (C) Lesion (blue) and contralateral brain (gray) ketone and metabolite concentrations before and after 8 weeks of Glioma Atkins-Based Diet (GLAD) dietary intervention. Asterisks indicate significant differences between hemispheres at either time point. (D) Changes in lesion and contralateral brain ketone and metabolite concentrations before and after 8-week dietary intervention in the lesional (green) and contralateral (gray) brain. Asterisks indicate significant differences between time points (*p ≤ 0.05, **p ≤ 0.01, ***p ≤ 0.001). Ace = acetone; bHB = β-hydroxybutyrate; Cho = phosphocholine; Gln = glutamine; Glu = glutamate; Glx = combination of Gln and Glu; Lac = lactate; NAA = N-acetylaspartic acid; tNAA = total NAA.

