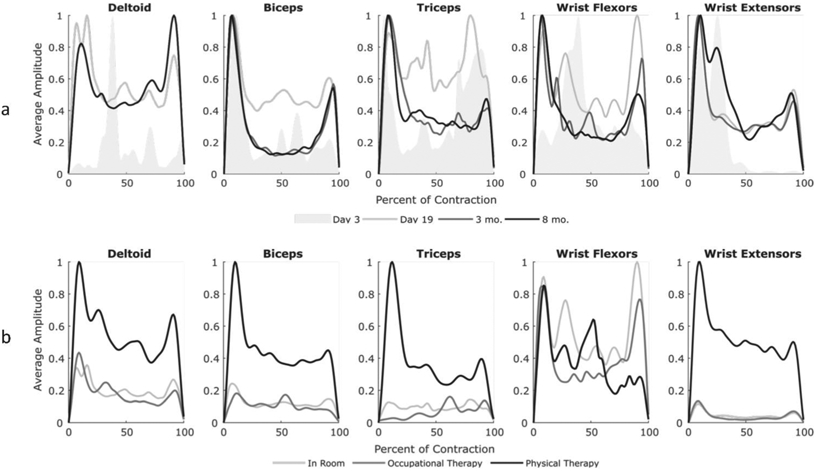
Figure 4.

Average amplitude of muscle contractions across days and activities. (a) Average contraction profiles normalized by length of contraction and the maximum of each visit. The standard deviation of the contraction profiles for the first recorded session on Day 3 is shown as a shaded region, while Day 19 and the three- and eight-month follow up are the average profiles. The deltoid did not have data for the three-month visit as it fell off the participant. (b) Average contraction profiles during Day 19 of inpatient rehabilitation normalized by each visit to compare between activity types. The deltoid, biceps, triceps, and wrist extensors exhibited similar average contraction shapes as well as relative amplitudes between activity types.
