
Figure 5.
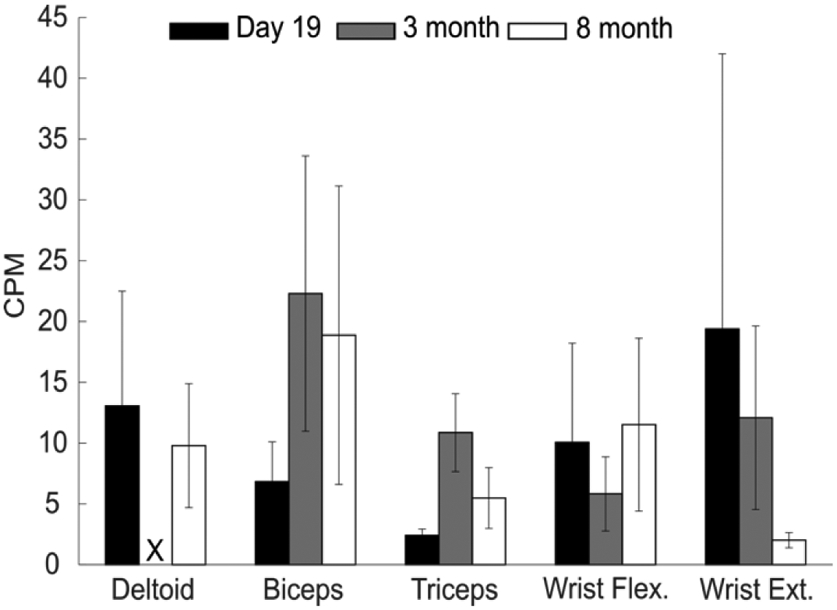
Contractions per minute by muscle group at discharge and follow up. Average contractions per minute during the last in-patient rehabilitation day and the three- and eight-month follow-up visit. Activity type for each session involved no therapy or workout but involved the participant’s daily activities. The vertical lines represent standard deviation, and no contractions between 100 and 500 ms were recorded for the Deltoid at the three-month follow up (X).