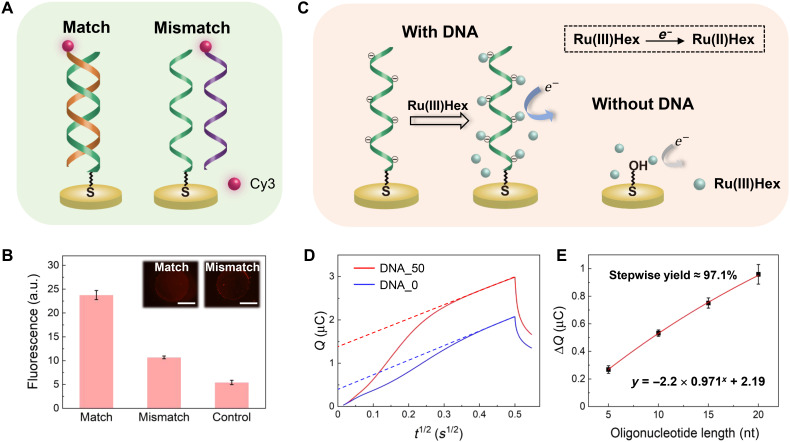
Fig. 2. Synthesis and characterization of DNA on the electrode.
(A) Schematic of the fluorescent determination of the synthesized oligonucleotide on the electrode using Cy3-labeled probes. (B) Fluorescence intensity measured for determination of the synthesized oligonucleotide on the electrode (insets, fluorescence micrographs of the electrodes). For the control experiment, the fluorescence from a blank Au electrode was measured without the hybridization reaction. The error bars represent the SD of three replicated measurements. Scale bars, 1 mm. a.u., arbitrary units. (C) Schematic of quantitative determination of the oligonucleotide based on chronocoulometric measurements. For the quantification, positively charged RuHex was stoichiometrically adsorbed on the electrode owing to electrostatic interaction with the DNA backbone and was then reduced so that the electric charges were correlated to the number of surface oligonucleotides. (D) Electric charges passed as a function of the square root of time for electrodes having the synthesized DNA in 10 mM tris-HCl (pH 8.3) containing 50 μM RuHex (red) or not (blue). The linear parts of the curves were fitted and marked using dash lines. (E) Electric charges attributed to the reduction of the stoichiometrically bound RuHex on the electrode as a function of the oligonucleotide length. The charges were calculated on the basis of the difference in the intercepts of the blue and red dash curves in (D) (37, 43). The error bars represent the SD of three replicated measurements, and the plots were fitted using an exponential attenuation model. Photo credit: Chengtao Xu, Southeast University.

