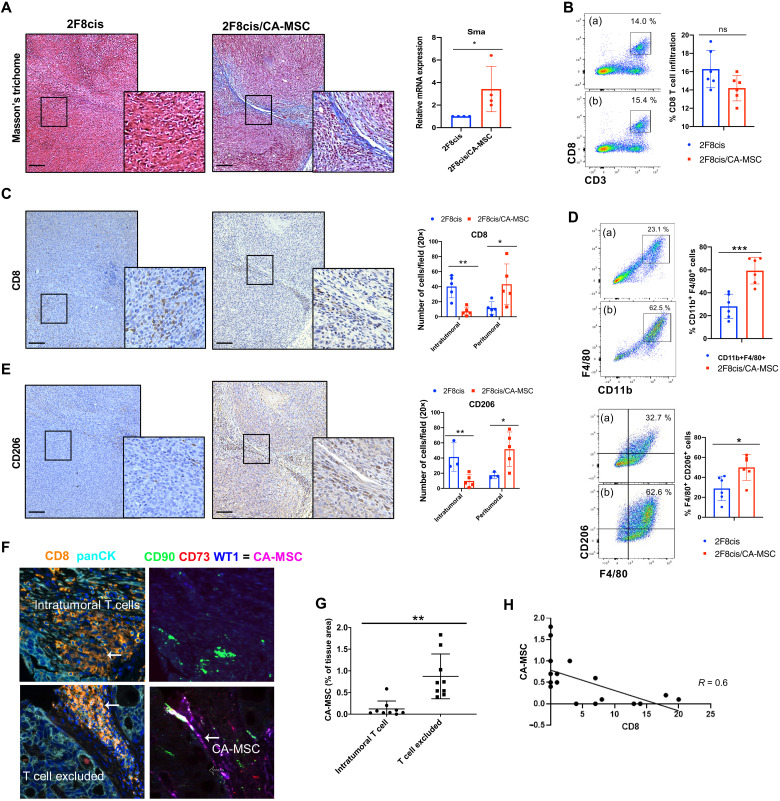
Fig. 1. The presence of CA-MSCs induces tumor immune cell exclusion.
(A) Representative images of Masson’s trichrome staining in 2F8cis and 2F8cis/CA-MSC tumor tissue sections and RT-qPCR analysis of Sma-1 (a marker associated with desmoplasia) mRNA expression in the indicated tumor groups. Gapdh was used as housekeeping gene. (B) Flow cytometric evaluation and summary of CD3+CD8+ T cells in 2F8cis (a) and 2F8cis/CA-MSC (b) tumors (n = 6 tumors per group). ns, not significant. (C) Representative IHC images and quantification of CD8+ T cells in 2F8cis and 2F8cis/CA-MSC tumor tissue sections. (D) Flow cytometric evaluation of CD11b+F4/80+ (top) and F4/80+CD206+ macrophages (bottom) in 2F8cis (a) and 2F8cis/CA-MSC (b). (E) Representative IHC images and quantification of anti-CD206 immunostaining in 2F8cis and 2F8cis/CA-MSC tumor tissue sections. (F) Representative multispectral imaging of the indicated cell markers in primary tumor samples from patients with high-grade serous ovarian cancer. (G) Percent of CA-MSCs present in patient tissue samples and scoring for intratumoral CD8+ T cells versus CD8+ T cell–excluded tissues. (H) The proportion of CA-MSCs plotted against the proportion of intratumoral CD8+ T cells (n = 18 patients evaluated). A close correlation was noted (R2 = 0.66). Error bars, SEMs. *P < 0.05, **P < 0.01, and ***P < 0.001. All results are representative of three independent experiments. Scale bars, 100 μm.

