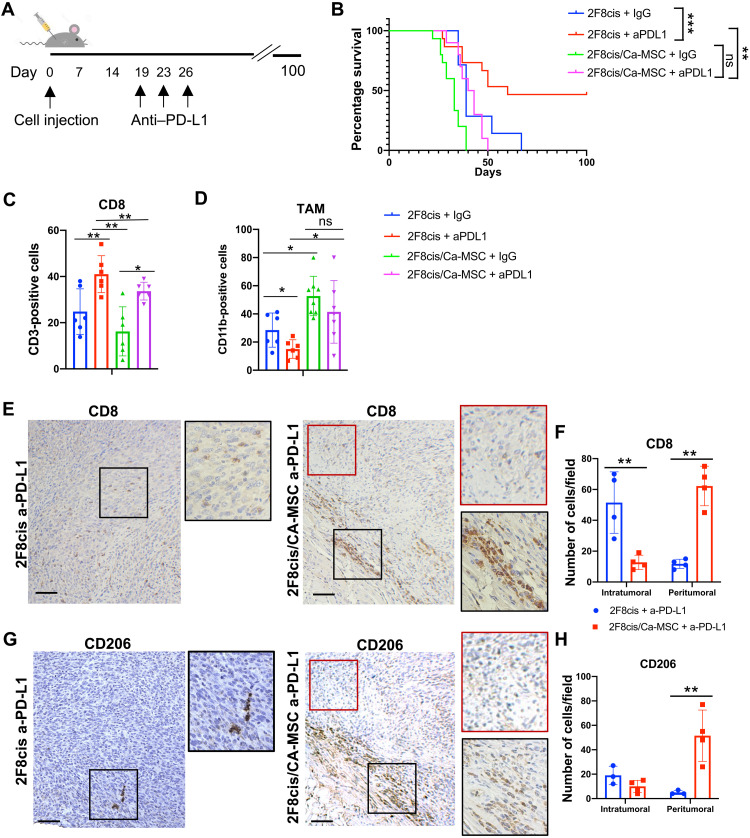
Fig. 2. CA-MSC–induced resistance to anti–PD-L1 therapy.
(A) Tumor treatment schema. (B) Kaplan-Meier overall survival analysis for the indicated tumor and treatment groups showing the time of injection and effect of anti–PD-L1 (a-PD-L1) treatment in 2F8cis or 2F8cis/CA-MSC tumors. ***P < 0.0001, 2F8cis versus 2F8cis + a-PD-L1; **P = 0.0042, 2F8cis + a-PD-L1 versus 2F8cis/CA-MSC + a-PD-L1; P > 0.9, 2F8cis/CA-MSC versus 2F8cis/CA-MSC + a-PD-L1. Survival statistics were calculated using log-rank analysis from Kaplan-Meier survival plots. (C and D) Summary of flow cytometry analysis (n = 6 tumors per group) for CD45+CD3+CD8+ T cells and CD45+CD11b+F4/80+CD206+ macrophages, respectively, in the indicated tumors/treatment groups. (E and F) Representative IHC images and quantification of CD8+ T cell localization in 2F8cis and 2F8cis/CA-MSC tumor tissue sections. (G and H) Representative IHC images and quantification of CD206+ cells in a-PD-L1–treated 2F8cis and 2F8cis/CA-MSC tumor tissue sections.

