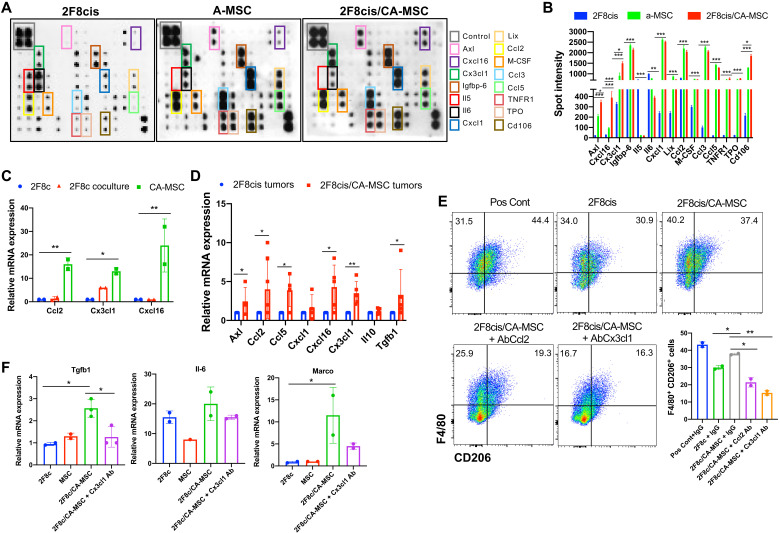
Fig. 3. 2F8cis/CA-MSC–secreted inflammatory cytokines induce a tumor-promoting macrophage phenotype.
(A and B) Cytokine array and densitometry of the CM of 2F8cis cells, a-MSCs, and 2F8cis/CA-MSCs. Spot intensities were calculated using ImageJ software and compared using two-way analysis of variance (ANOVA). (C) Summary of RT-qPCR analysis of mRNA expression of the indicated genes in CTV-labeled a-MSCs directly cocultured with 2F8cis cancer cells for 7 days. The CTV-labeled CA-MSCs were sorted via FACS from 2F8cis coculture. 2F8cis cells cultured alone were used as control (2F8c). (D) Summary of RT-qPCR analysis of mRNA expression of the indicated genes in the indicated tumors. Results are averages of two independent experiments, each performed in triplicate. (E and F) Flow cytometric and RT-qPCR analyses of F4/80+CD206+ cells generated from BM-derived and differentiated macrophages cultured with the CM of 2F8cis cells or 2F8cis/CA-MSCs with or without neutralizing antibodies to Ccl2 or Cx3cl1. Macrophages stimulated with GM-CSF and IL-4 were used as positive controls (Pos Cont). In all RT-PCR experiments, Gapdh was used as housekeeping gene. P values were calculated using one-way or two-way ANOVA with Tukey posttest for multiple comparisons. Error bars, SEMs. *P < 0.05, **P < 0.01, and ***P < 0.001. All results are representative of three independent experiments.

