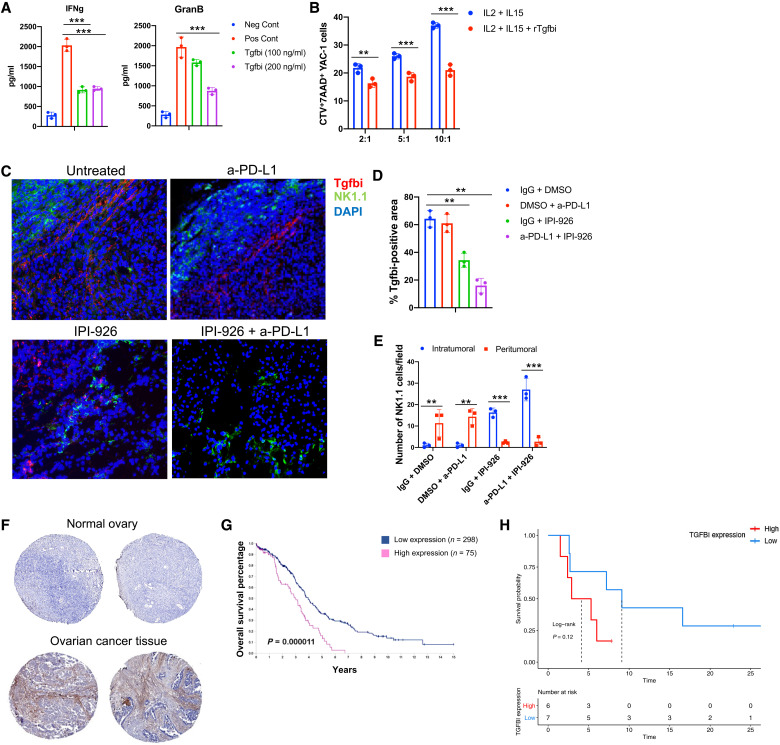
Fig. 7. Tgfbi reduces NK tumor killing activity, and its expression negatively correlates with ovarian cancer patient prognosis and response to ICI.
(A) Summary of ELISA analysis of activated (Il-2/Il-15–treated) splenic NK cell IFN-γ or granzyme B secretion in control and rTgfbi-treated cells. Unstimulated NK cells were used as negative control (Neg Cont). (B) Activated NK tumor cell killing activity of YAC-1 target cells, with the indicated effector:tumor cell ratios in the presence or absence of Tgfbi. Results were analyzed by two-way ANOVA. (C) Representative IF (immunofluorescence) images showing Tgfbi expression and NK cell localization in control or indicated treated 2F8cis/CA-MSC tumor tissue sections. DAPI, 4′,6-diamidino-2-phenylindole. (D) Graphs represent the percentage of positive stained areas for Tgfbi in control or indicated treated 2F8cis/CA-MSC tumors. (E) Graph shows the abundance of NK1 cells in the indicated treatments of 2F8cis/CA-MSC tumors (n = 3 tumors per group). (F) Representative images from The Human Protein Atlas of TGFBI IHC staining in normal and ovarian carcinoma tissues. (G) Kaplan-Meier overall survival analysis based on high versus low TGFBI expression. (H) Progression-free survival analysis of patients with ovarian cancer (n = 14) based on expression of TGFBI, comparing those patients expressing above the median expression to those expressing at or below the median. Results were analyzed using two-way ANOVA. Error bars, SEMs. *P < 0.05, **P < 0.01, and ***P < 0.001.

