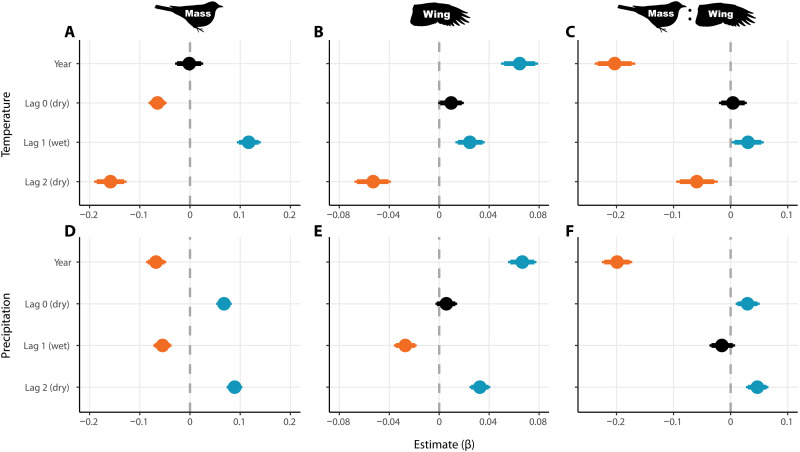
Fig. 3. Bird morphology modeled by time trend and climate covariates.
Each panel shows parameter estimates of a single model for one of the three metrics representing bird morphology in the community as a whole as response (columns), and time trend (year) and temperature (A to C) or precipitation (D to F) as covariates. Lag 0 is the season of capture (dry season), with lags 1 and 2 the previous wet and dry seasons, respectively. Points are medians with 90% and 95% CIs. Estimates are colored orange if 95% CIs are entirely negative, blue if entirely positive, or black if overlapping zero. Results correspond to models 20, 21, 23, 24, 26, and 27 (table S4).

