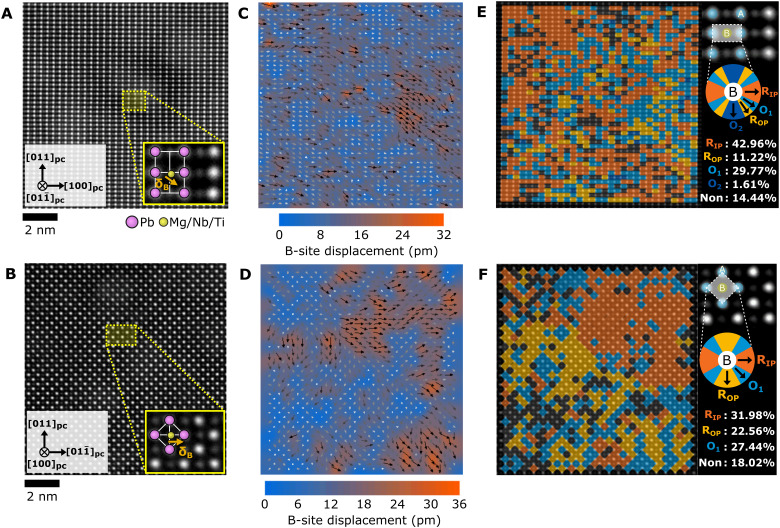
Fig. 4. STEM analysis of domains present in the PMN-PT membrane.
(A and B) Atomic resolution high-angle annular dark-field (HAADF)–STEM images along theand [100]pc zone axes, respectively. The insets are enlarged images in each zone axis. Pink circles are A-site cations (Pb) and yellow circles are B-site cations (Mg/Nb/Ti). Orange arrows are the B-site displacement (δB). (C and D) B-site cation displacement mapping with overlaid arrows indicating regions of short-range ordering. Color maps show the atomic displacement magnitude, and arrows display the direction of atomic displacement. (E and F) Phase fraction mapping in each unit cell with color wheel by expected B-site displacement directions for RIP (R1), ROP (R2), and regions that have displacements between the R states labeled as orthorhombic O1 and O2. Color blank regions (Non) indicate the nonpolar region under the 7 pm of B-site displacement.

