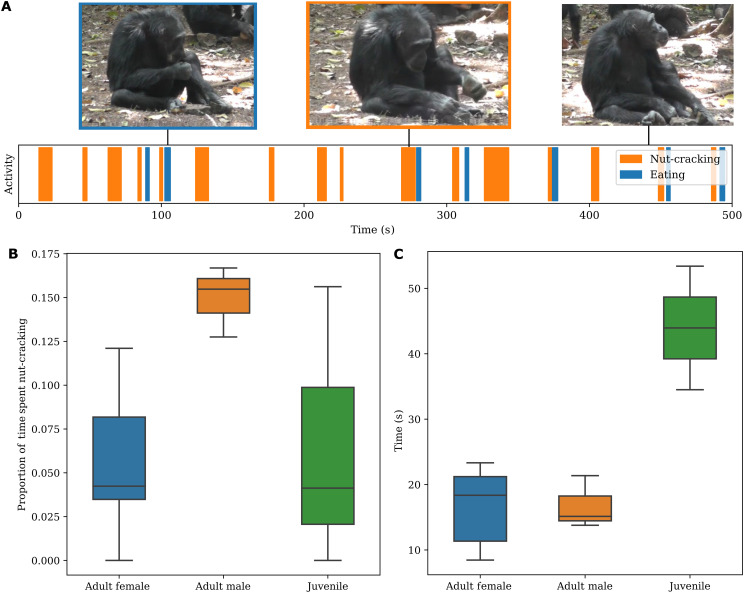
Fig. 4. Nut cracking analysis.
(A) An example activity sequence following a single individual over the course of a video. The blank white spaces are any activities that are not nut cracking or eating. Note that eating typically follows nut cracking events. (B) Proportion of time spent nut cracking as a fraction of total time visible. (C) Average time spent nut cracking per eating event. Computed by dividing the cumulative time spent nut-cracking over the total number of eating events as a function of age and sex. Photo credit: Kyoto University, Primate Research Institute.

