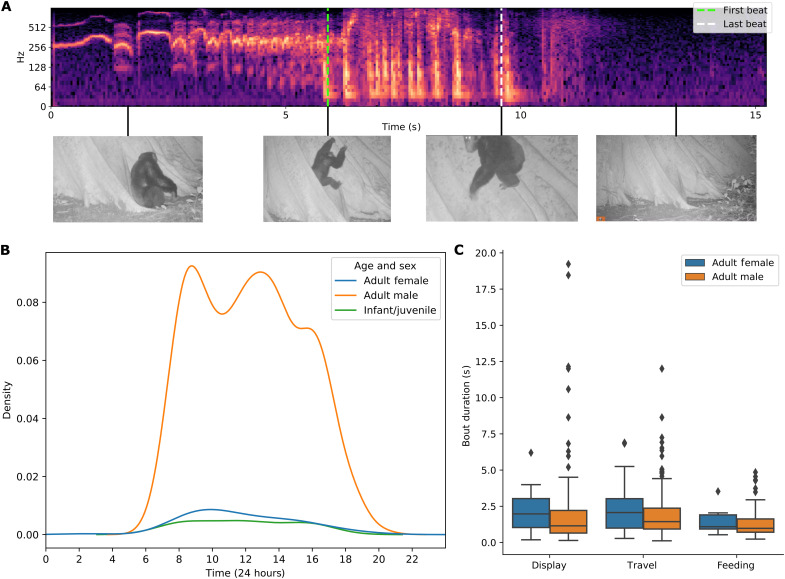
Fig. 5. Buttress drumming analysis.
(A) Spectrogram showing a detected drumming bout delineated by the first and last beats, with video frames visualized. (B) Kernel density estimation plot showing the diel distribution of buttress drumming bouts, based on hh:mm:ss data captured by camera traps. (C) Duration (in seconds) of buttress drumming bouts by context (agonistic display, travel, and feeding) and by age/sex (adult females and adult males). Photo credit: The Cantanhez Chimpanzee Project.

