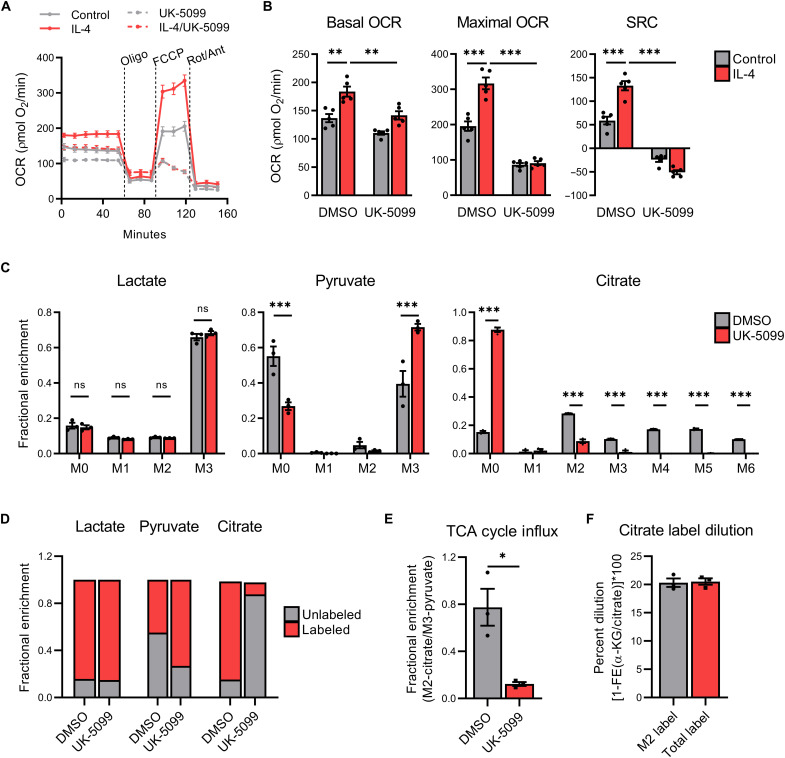
Fig. 2. M2 macrophages actively metabolize lactate within the mitochondrial TCA cycle.
(A) Trace, (B) (left) basal OCR, (middle) maximal OCR, and (right) SRC of BMDMs pretreated ± UK-5099 (25 μM) and then polarized with IL-4 (20 ng/ml) or vehicle control (PBS) for 24 hours before extracellular flux analysis with oligomycin (oligo), carbonyl cyanide p-trifluoromethoxyphenylhydrazone (FCCP), and rotenone plus antimycin A (Rot/Ant). Fractional enrichment of (C) lactate (left), pyruvate (middle), and citrate (right) in BMDMs starved in GF media + 10% dFBS (4 hours) before pretreatment with UK-5099 (25 μM), supplementation with 13C-lactate (10 mM), and then polarization with IL-4 (20 ng/ml) for 6 hours. (D) Cumulative comparison of unlabeled (M0) versus labeled lactate (M1 to M2), pyruvate (M1 to M2), and citrate (M1 to M6). (E) Metabolic influx of lactate derived carbons into the TCA cycle and (F) percent dilution of M2- and total- (M2 to M6) citrate labeling into α-ketoglutarate (α-KG), as determined by 1–fractional enrichment (FE) of α-KG/citrate, in BMDMs treated as previously indicated. Data are presented as means ± SEM of four (A and B) or three (C to F) replicates. *P ≤ 0.05, **P ≤ 0.01, ***P ≤ 0.001 by two-way ANOVA (A to C) or Student’s t test (E).

