
Figure 1.
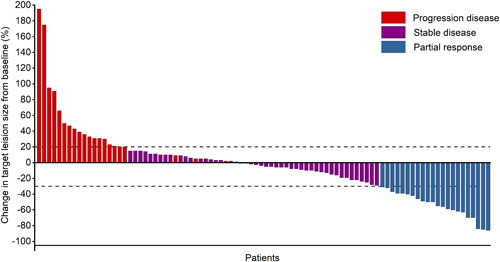
Waterfall plots show the maximum percentage change in target lesion size during active treatment with PD‐1/PD‐L1 inhibitors. PD‐1/PD‐L1, programmed death 1 (PD‐1)/programmed death‐ligand 1
Official websites use .gov
A
.gov website belongs to an official
government organization in the United States.
Secure .gov websites use HTTPS
A lock (
) or https:// means you've safely
connected to the .gov website. Share sensitive
information only on official, secure websites.
Waterfall plots show the maximum percentage change in target lesion size during active treatment with PD‐1/PD‐L1 inhibitors. PD‐1/PD‐L1, programmed death 1 (PD‐1)/programmed death‐ligand 1