
Figure 3.
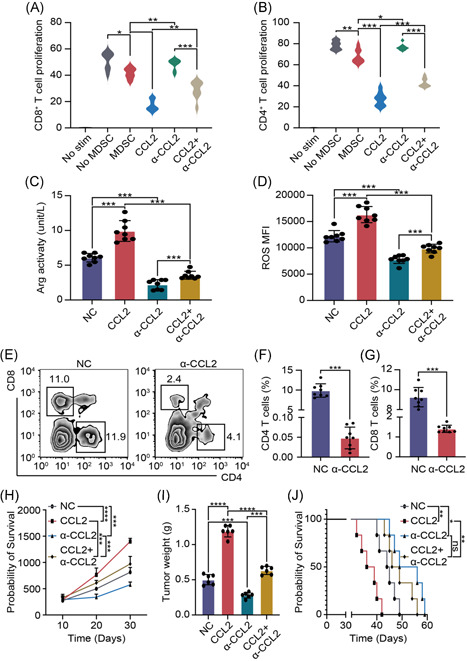
CCL2 promoted PDAC progression by enhanced immune suppression ability of M‐MDSCs. (A, B) Proliferating rates of CD8+ T cells and CD4+ T cells. (C) ELISA assay was used to test Arg activity. (D) Flow cytometry was used to test ROS level. (E–G) Flow cytometry images and statistical results of CD8+ T cells and CD4+ T cells proportion. (H) PDAC volume was recorded every 10 days. (I) Tumor weight was recorded after mice were sacrificed. (J) Survival time of PDAC mice models. Mean ± SEM. Arg, arginase; CCL2, C‐C motif chemokine ligand 2; ELISA, enzyme‐linked immunosorbent assay; M‐MDSC, monocytic myeloid‐derived suppressor cell; NC, negative control; PDAC, pancreatic ductal adenocarcinoma; ROS, reactive oxygen species. *p < .05, **p < .01, ***p < .005