
Figure 2.
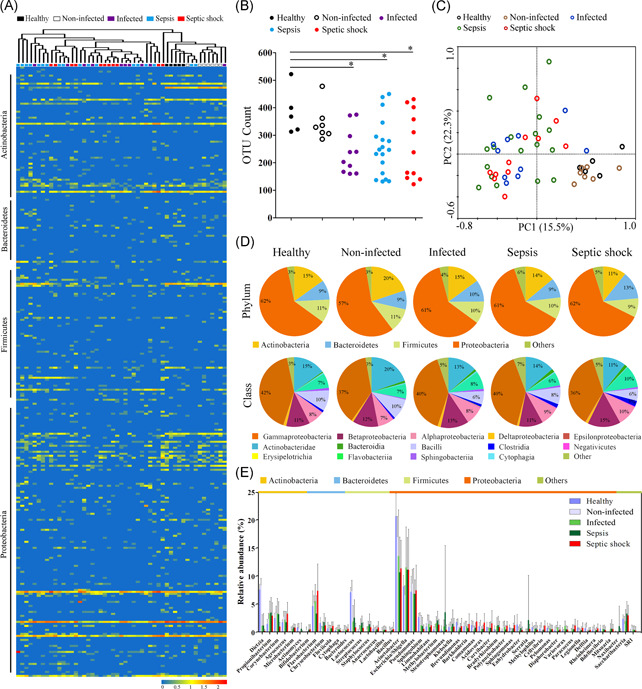
Composition and diversity of blood bacterial microbiome in surgical patients across various stages of sepsis. (A) The relative abundance of the bacterial genera identified by taxonomic classification, as revealed by a heatmap graph. The clustering relationships across the blood samples are shown in the upper panel. (B) Comparative analysis of the species richness of the blood microbiomes among groups. The species richness is expressed as the counts of the observed OTUs at the same sequencing depth. *p < .05 versus healthy subjects. (C) Principal coordinate analysis (PCoA) plot of weighted UniFrac distances between the blood samples from five groups. (D) Determination of the predominant bacterial composition in the blood microbiome at the phylum and class levels. (E) Shifts in the relative abundance of the top 50 most abundant bacterial genera among groups