
Figure 6.
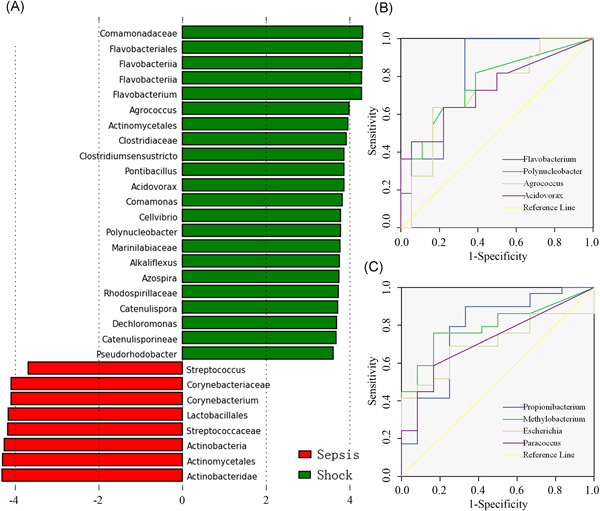
Variations of blood bacterial microbiome in septic shock patients. (A) Significantly discriminative taxa between the septic shock patients and sepsis cases were determined by linear discriminant analysis effect size (LEfSe) analysis. The green bar chart represents the bacteria taxa enriched in blood samples of septic shock patients, and the red bar chart represents the sepsis individuals. (B) Receiver operating characteristic (ROC) curves for prediction values of some specific bacterial genera. ROC curves of discriminating patients with septic shock from sepsis patients (95% confidence interval). (C) ROC curves of discriminating septic patients (including sepsis and septic shock) from noninfected controls