Figure 1.

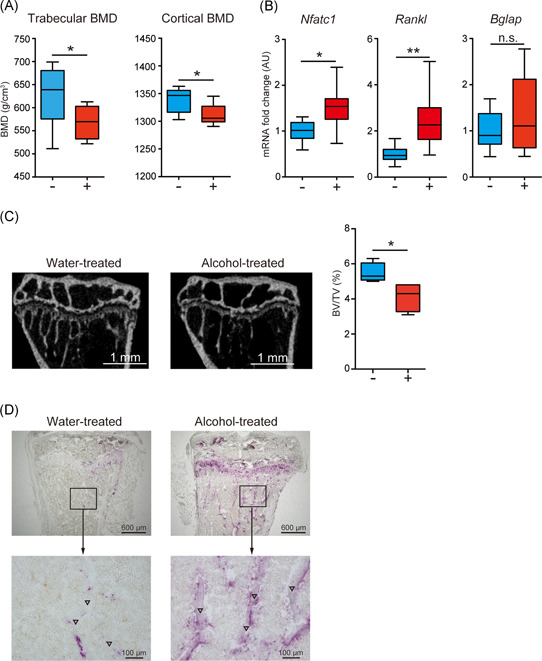
Alcohol consumption induces bone loss with the upregulation of genes related to osteoclast differentiation. (A) Trabecular and cortical bone mineral density (BMD) in alcohol‐treated (red) and water‐treated (blue) B6 mice, as measured using quantitative computed tomography. (B) Messenger RNA expression of Nfatc1, Rankl, and Bglap in bone from alcohol‐treated (red) and water‐treated (blue) B6 mice. (C) The representative feature of tibia treated with water and 10% ethanol (left), and the bone volume/total tissue volume (BV/TV) ratio (right) evaluated using micro‐computed tomography. (D) Tartrate‐resistant acid phosphatase staining of mice tibia treated with water (left panel) and 10% ethanol (right panel). Osteoclasts are represented in purple, (▽) indicates the bone matrix. Box plots: horizontal lines of boxes represent the medians, the boxes represent the interquartile ranges, and the whiskers extend to extreme values (8 mice/group). The data were pooled from six independent experiments. *p < .05, **p < .01; Mann–Whitney U test. n.s., not significant
