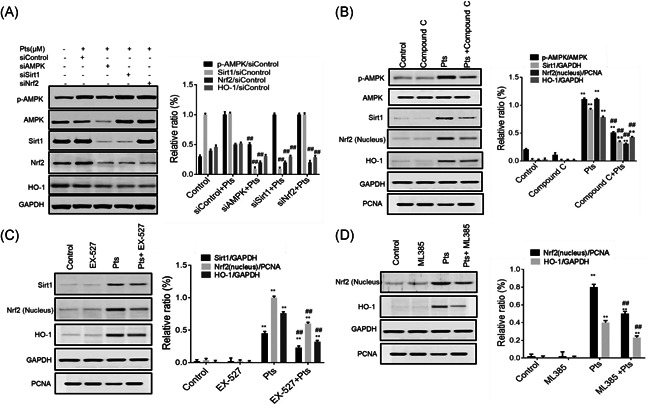
Figure 6.

Potential interaction between signaling pathways of AMPK/Sirt1 and Nrf2/HO‐1. The 16HBE cells were treated as described in the method. The protein level was detected by western blot. (A) The levels of p‐AMPK, Sirt1, Nrf2 and HO‐1. ## p < .01, compared with the siControl + Pts group. (B) p‐AMPK, Sirt1, Nrf2 and HO‐1 levels. **p < .01, compared with the Control group. ## p < .01, compared with the Pts group. (C) Sirt1, Nrf2 and HO‐1 levels. **p < .01, compared with Control group. ## p < .01, compared with the Pts group. (D) Nrf2 and HO‐1 levels. **p < .01, compared with Control group. ## p < .01, compared with the Pts group. Each data value represents mean ± SD. AMPK, adenosine 5ʹ‐monophosphate‐activated protein kinase; GAPDH, glyceraldehyde 3‐phosphate dehydrogenase; HO‐1, Heme oxygenase‐1; Nrf2, nuclear factor‐E2‐related factor 2; Pts, Pterostilbene
