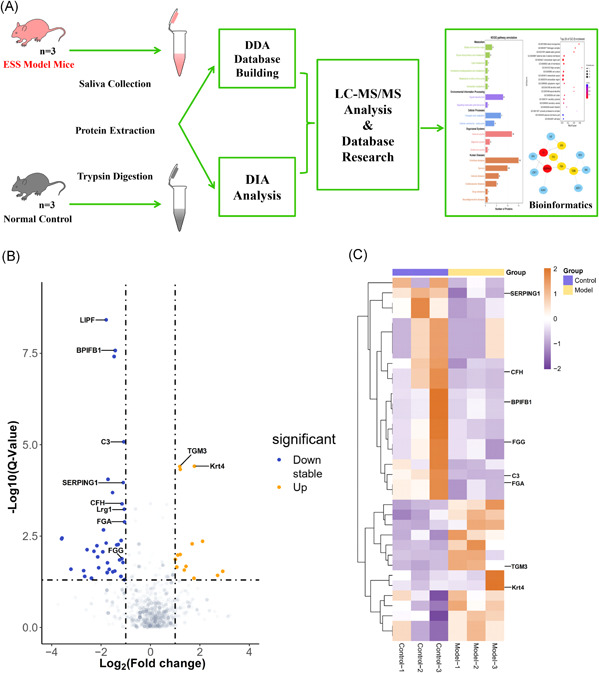
Figure 3.

The schematic flow to study the proteome of saliva in ESS model mice (A). Volcano‐plot and heatmap of DEPs. Volcano‐plot (B) and heatmap (C) of DEPs in the saliva of ESS mice relative to the controls. Blue color indicates downregulation and orange color indicates upregulation. The x‐axis represents Q‐value and the y‐axis represents the value of log2 (Fold change) in volcano‐plot (B). The heatmap (C) shows 36 DEPs in the saliva of ESS mice relative to controls, including 14 upregulated (orange) and 22 downregulated (blue) proteins. DDA, data‐dependent acquisition; DEP, differentially expressed protein; DIA, data‐independent acquisition; ESS, experimental Sjögren's syndrome
