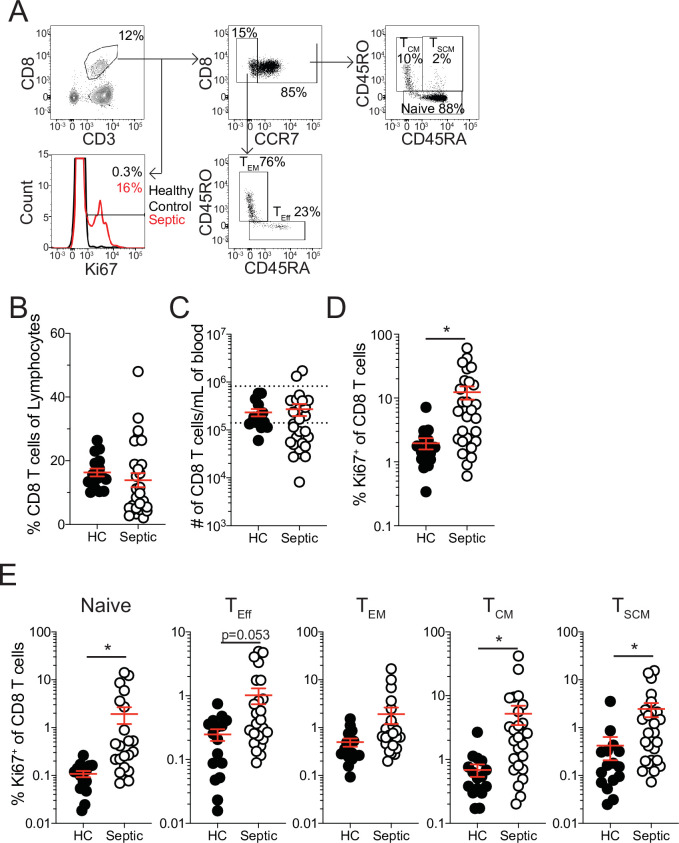
Figure 1. Increased proliferation among CD8 T cells of septic patients.
(A) Representative gating for CD8 T cell subsets and Ki67 expression from healthy controls and septic patients (within 24 hr of hospital admission). (B) Frequency and (C) number of CD8 T cells among lymphocytes in healthy controls and septic patients. Dashed lines indicate the normal range for the number of CD8 T cells per mL of blood. (D) Frequency of Ki67 expressing CD8 T cells in healthy controls and septic patients. (E) Frequency Ki67 expressing cells among Naïve, Effector (TEff), Effector Memory (TEM), Central Memory (TCM), and Stem Cell Memory (TSCM) CD8 T cells from healthy controls and septic patients. Data are representative of 2 independent experiments with 16–27 patients per group. *=p < 0.05. Error bars in represent standard error of the mean.


