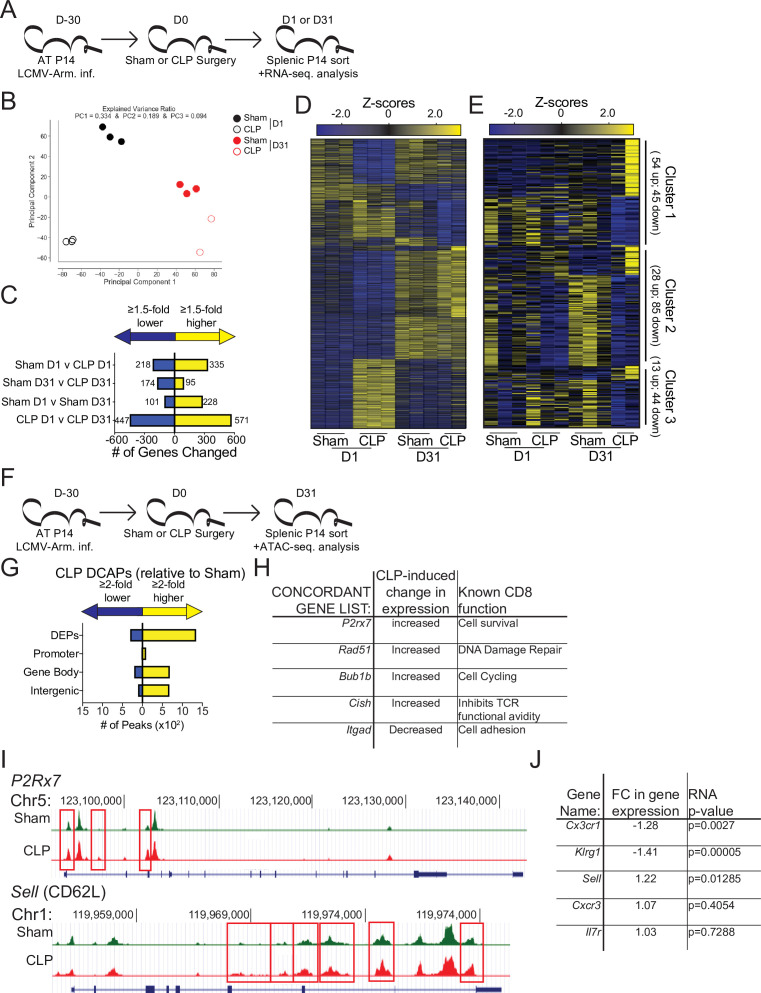
Figure 5. Sepsis alters the gene expression and chromatin accessibility of pre-existing memory CD8 T cells.
(A) Experimental Design: Antigen-experienced P14 chimeric mice were generated by adoptive transfer of 5 × 10³ naive Thy1.1+ TCR-transgenic P14 CD8 T cells to Thy1.2+ C57Bl/6 mice that were subsequently infected with LCMV-Arm. Mice underwent Sham or CLP surgery 30 days after infection. Splenic P14 CD8 T cells were FACS-sorted one or 31 after surgery for RNA extraction. P14 CD8 T cells were isolated from 3 D1-Sham hosts, 3 D1-CLP hosts, 3 D31-Sham hosts, and 2 D31-CLP hosts. (B) Principal Component analysis of P14 CD8 T cells from Sham and CLP hosts either 1- or 31 days post-surgery. (C) Number of statistically significant gene changes as a result of indicated comparisons. (D) Gene expression heatmap of genes with statistically significant changes (fold change >1.5, p < 0.05) as a result of any comparison. (E) Gene expression heatmap of genes with statistically significant changes (fold change >1.5, p < 0.05) between D31 Sham and CLP P14 CD8 T cells. Clusters were consecutively defined by similar expressional changes in: D1 to D31 Sham P14 CD8 T cells and D31 Sham to CLP P14 CD8 T cells [Cluster 1], D1 Sham to CLP P14 CD8 T cells and D31 Sham to CLP P14 CD8 T cells [Cluster 2], and non-defined by prior categorization [Cluster 3] (F) Experimental Design: Antigen-experienced P14 chimeric mice were generated by adoptive transfer of 5 × 10³ naive Thy1.1+ TCR-transgenic P14 CD8 T cells to Thy1.2+ C57Bl/6 mice that were subsequently infected with LCMV-Arm. Mice underwent Sham or CLP surgery 30 days after infection. Splenic P14 CD8 T cells were FACS-sorted 31 days after surgery for assessment of chromatin accessibility. P14 CD8 T cells were isolated from 2 D31-Sham hosts and 3 D31-CLP hosts. (G) Total number of differential chromatin accessibility peaks (DCAPs, fold change >2 p < 0.05) and delineation of those within either a promoter, gene body, or intergenic regions assigned to the most proximal to a transcription start site. (H) List of genes whose change in transcript is concordant with changes in chromatin accessibility along with the relative change and known function in CD8 T cells. (I) Example of differentially expressed peaks (indicated by the red box) within the P2R×7 and Sell gene loci from representative Sham and CLP P14s. (J) List of genes whose expression defined the phenotypically distinct populations between Sham and CLP P14 CD8 T cells in Figure 3 alongside their fold change in transcript and the p-value associated with that fold-change.

