. 2021 Oct 15;10:e71013. doi: 10.7554/eLife.71013

Figure 3. Transcription start site sequencing (TSS-seq) identifies global ssl2 initiation effects.

(A) TSS-seq library construction as in Vvedenskaya et al., 2015. See Materials and methods for details. (B) Scatter plot showing the correlation of log2 transformed reads at individual genome positions for all positions ≥ 3 reads for each library for example replicate pairs for SSL2 wild type (WT), ssl2 N230D, or ssl2 N230I, see Figure supplements for other libraries and description of biological replicates performed for all genotypes. (C) Hierarchical clustering of Pearson r correlation coefficients for libraries of combined biological replicates.

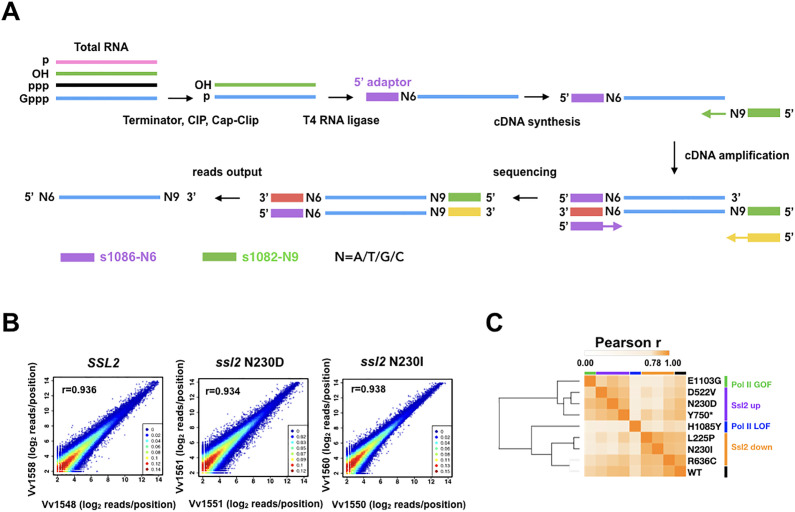
Figure 3—source data 1. Figure 3C Heatmap data.

Figure 3.

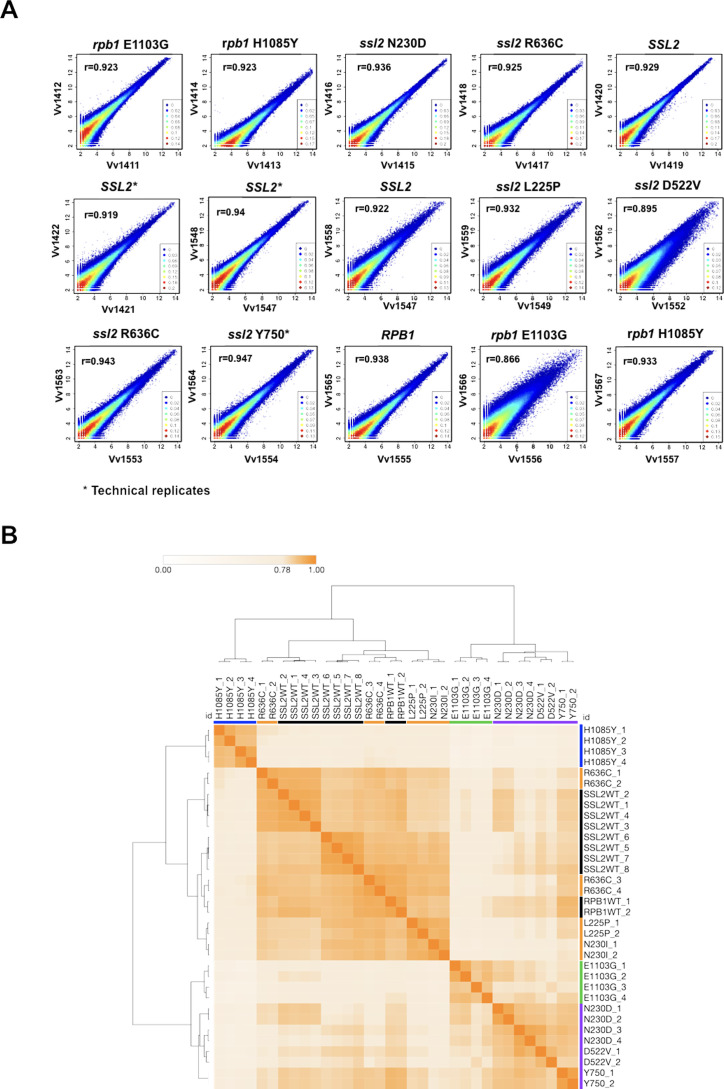
Figure 3—figure supplement 1. Correlation of read counts between transcription start site sequencing (TSS-seq) replicates at TSSs across the genome.

Figure 3—figure supplement 1.

(A) Scatter plot showing the correlation of sequencing reads across all genome positions for all positions ≥ 3 reads between replicates in ssl2 and polymerase II (Pol II) mutants. (B) Matrix heatmap and the hierarchical clustering of Pearson correlation coefficients between TSS-seq libraries from independent biological replicates labeled by substitution and replicate number (H1085Y and E1103G are rpb1 alleles, all others are ssl2). SSL2WT_2,3,4 are technical replicates as are SSL2WT_5,6,7. All other libraries represent biological replicates. Color bars indicate allele class as described in Figure 1.
Figure 3—figure supplement 1—source data 1. Figure 3—figure supplement 1B Heatmap data.